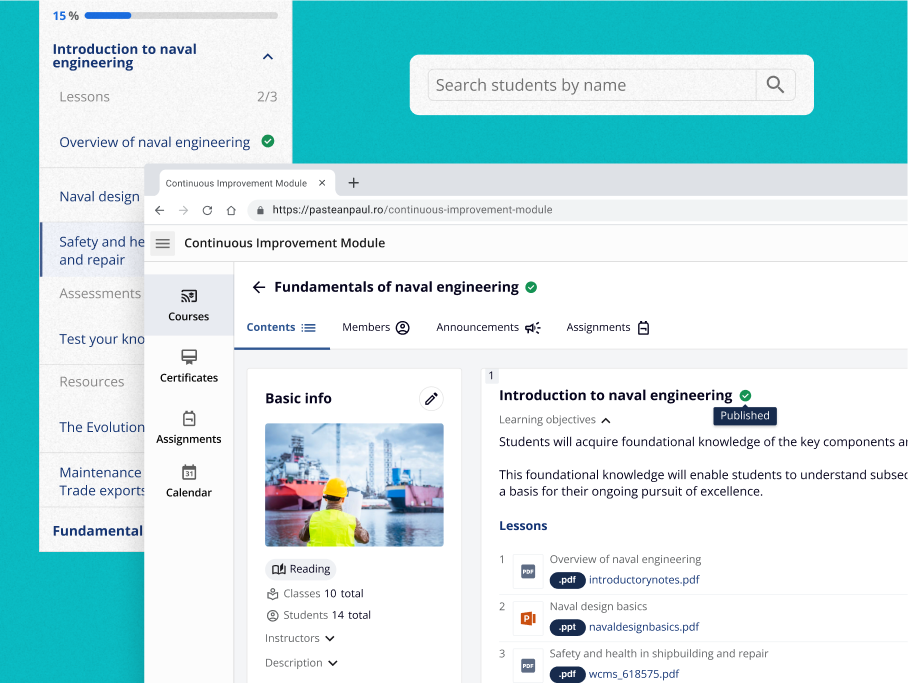
Managing maintenance for hundreds of ships requires visibility into the condition of every component and subcomponent, each with different priorities and timelines. My task was to upgrade a legacy tool such that lieutenants could adequately plan maintenance work across hundreds of ships.
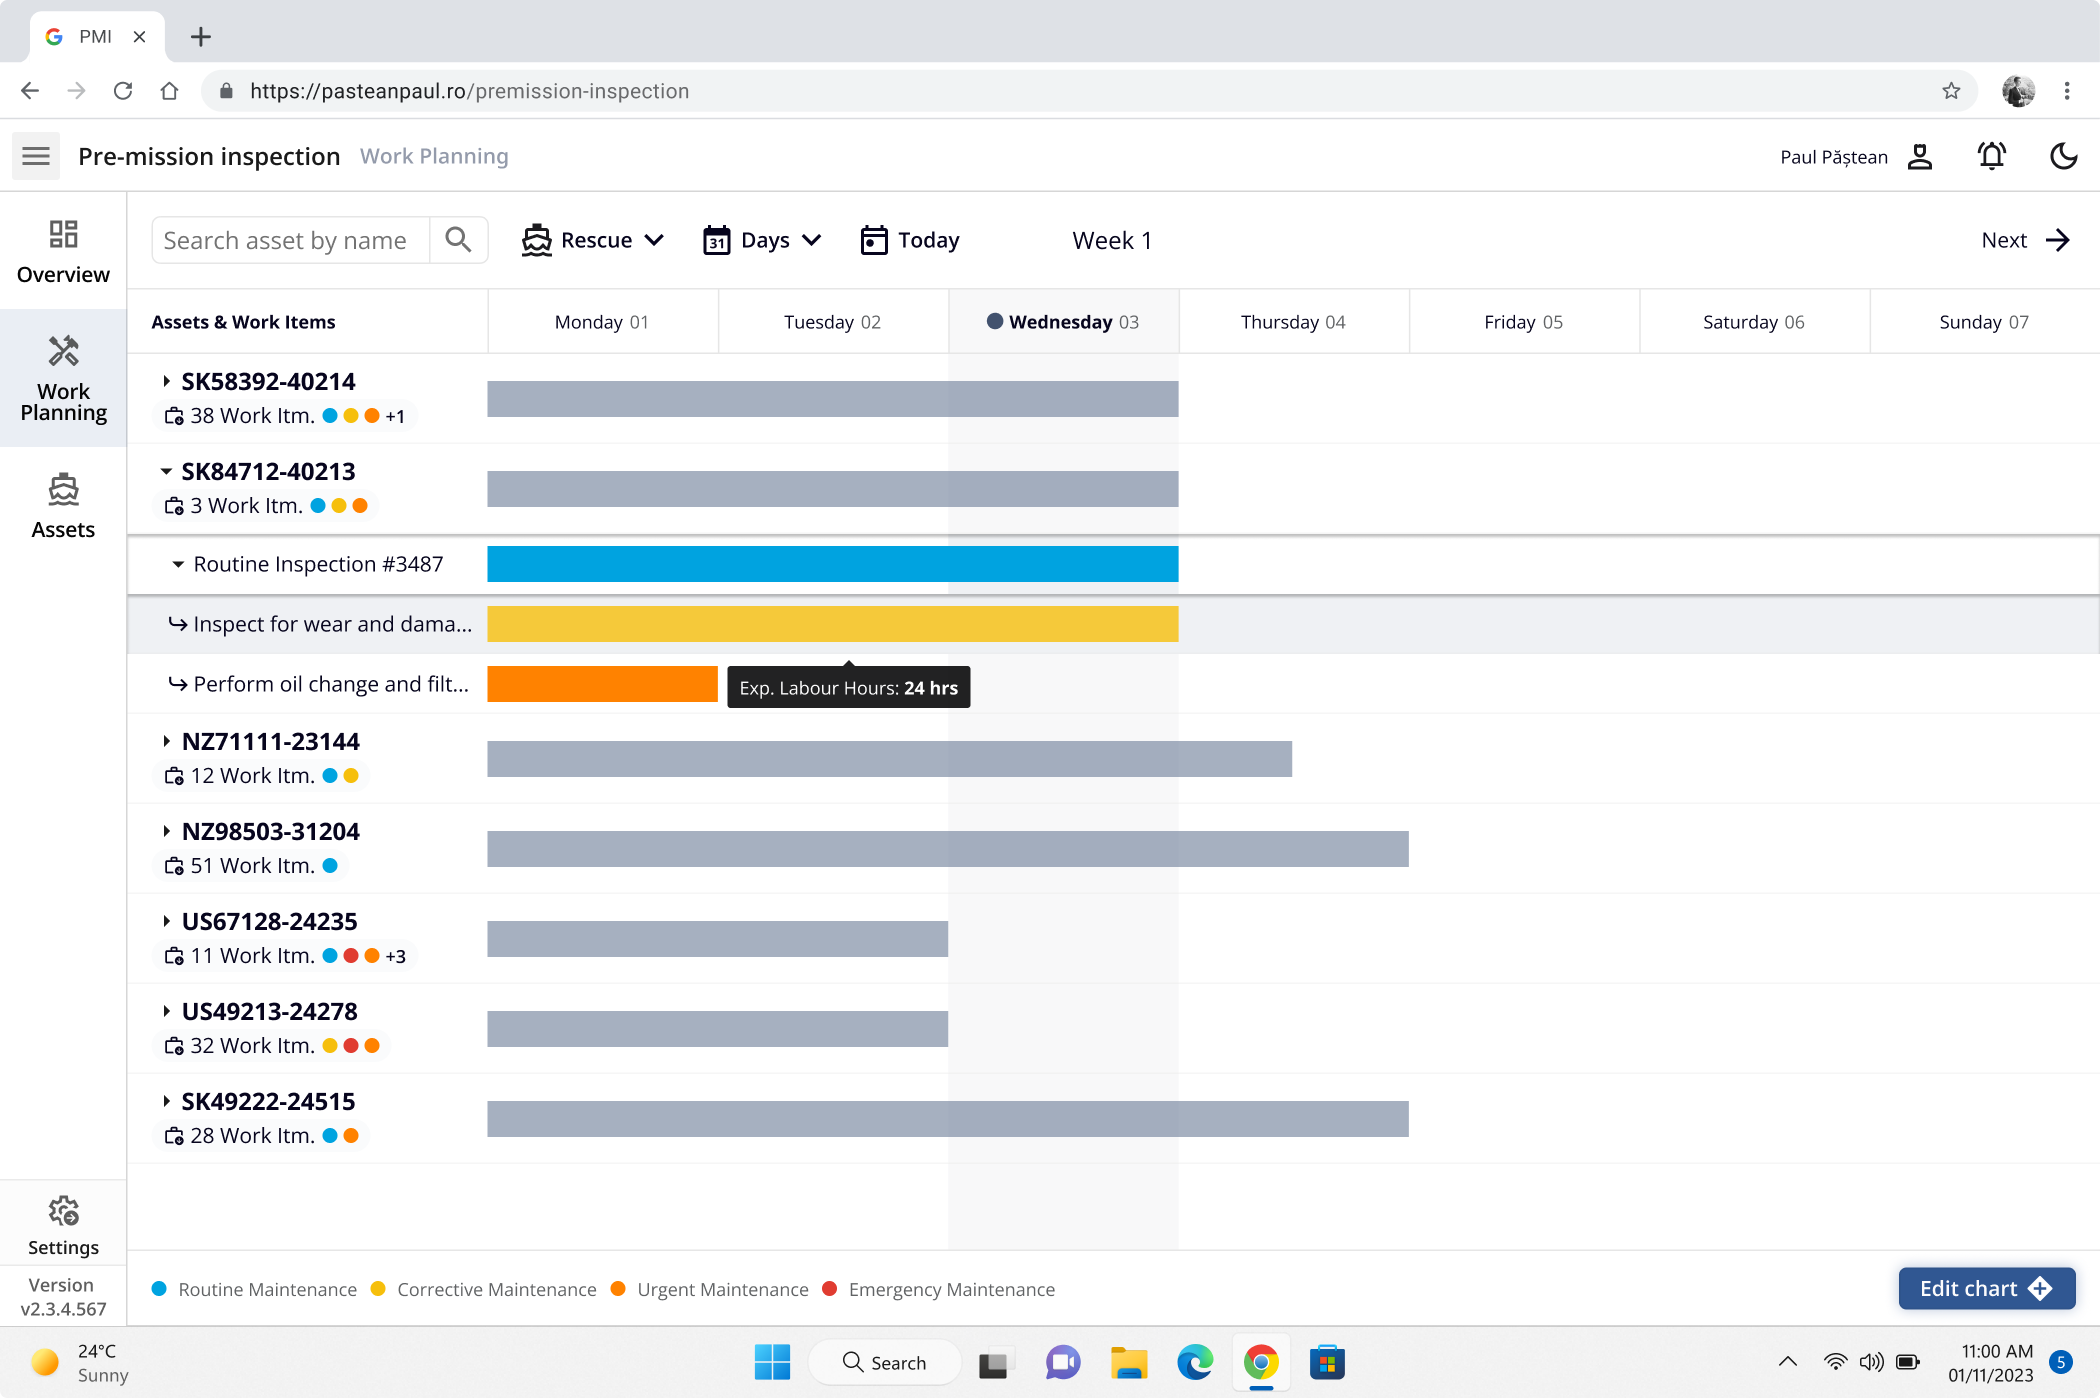
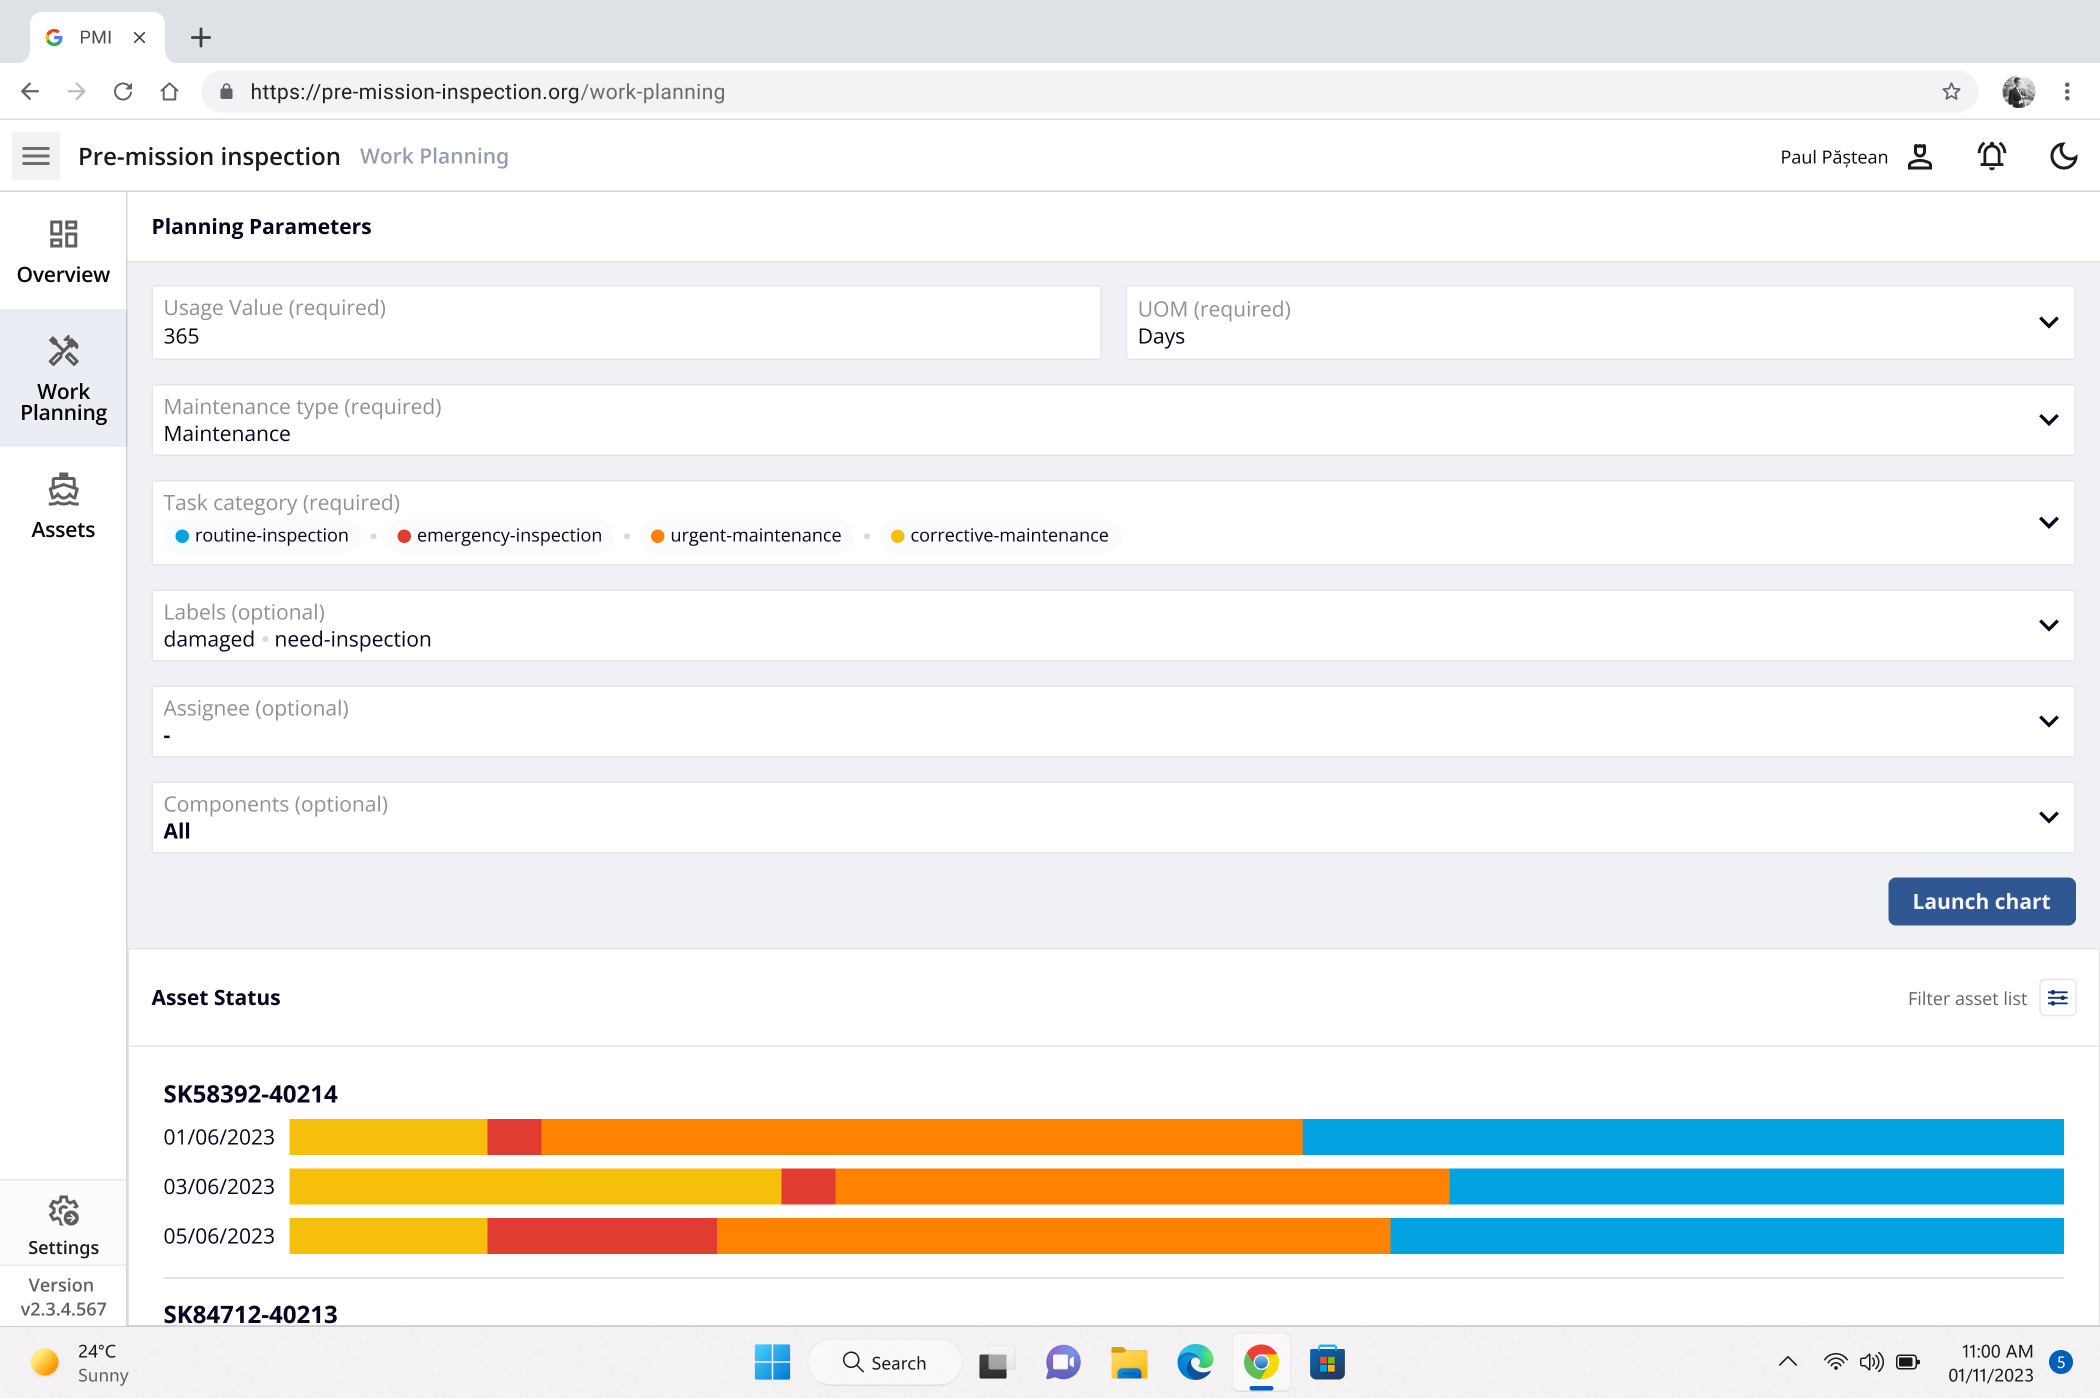
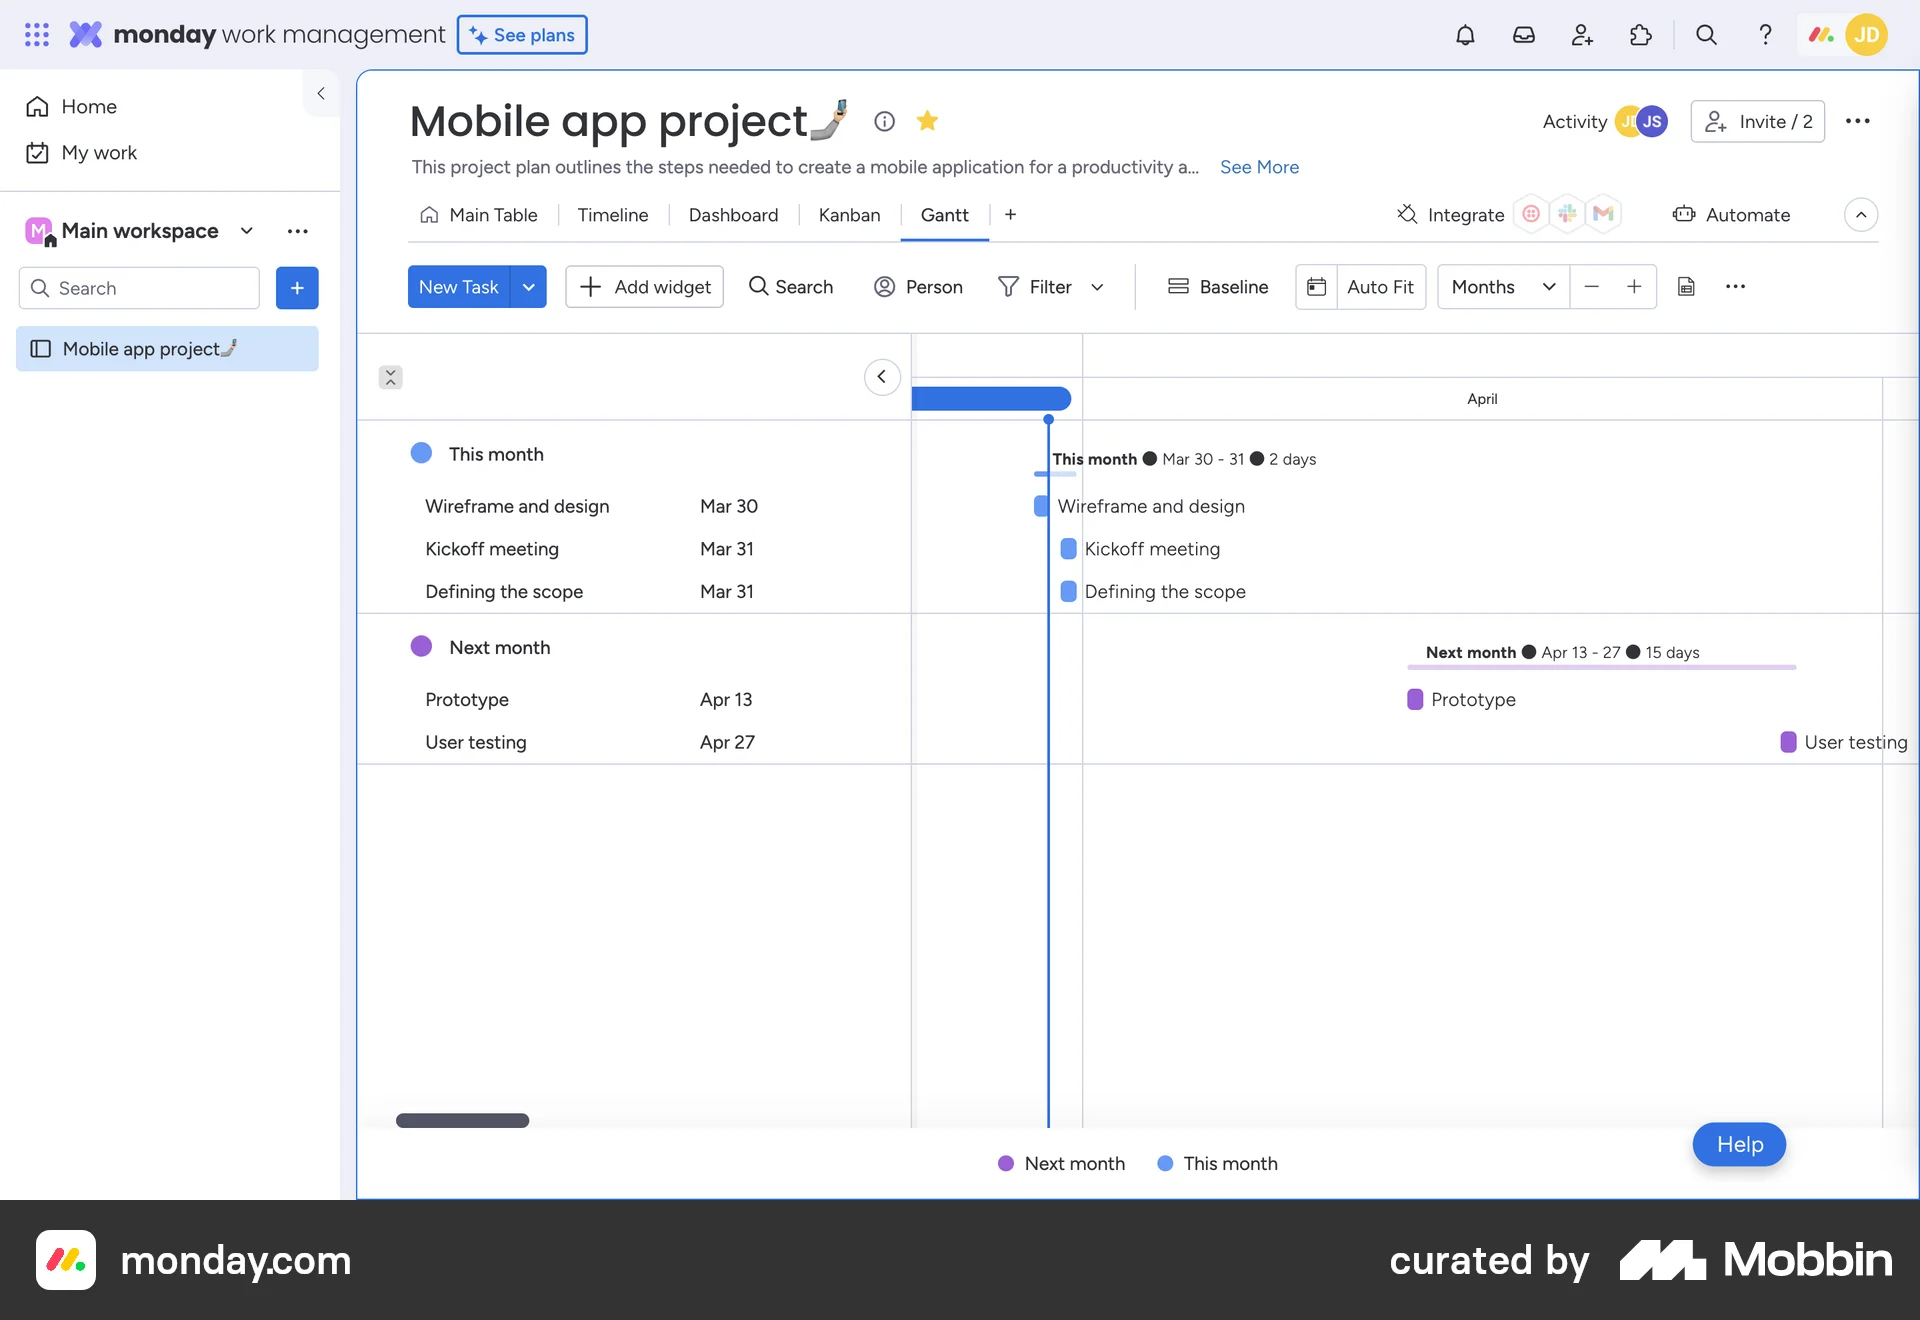
After
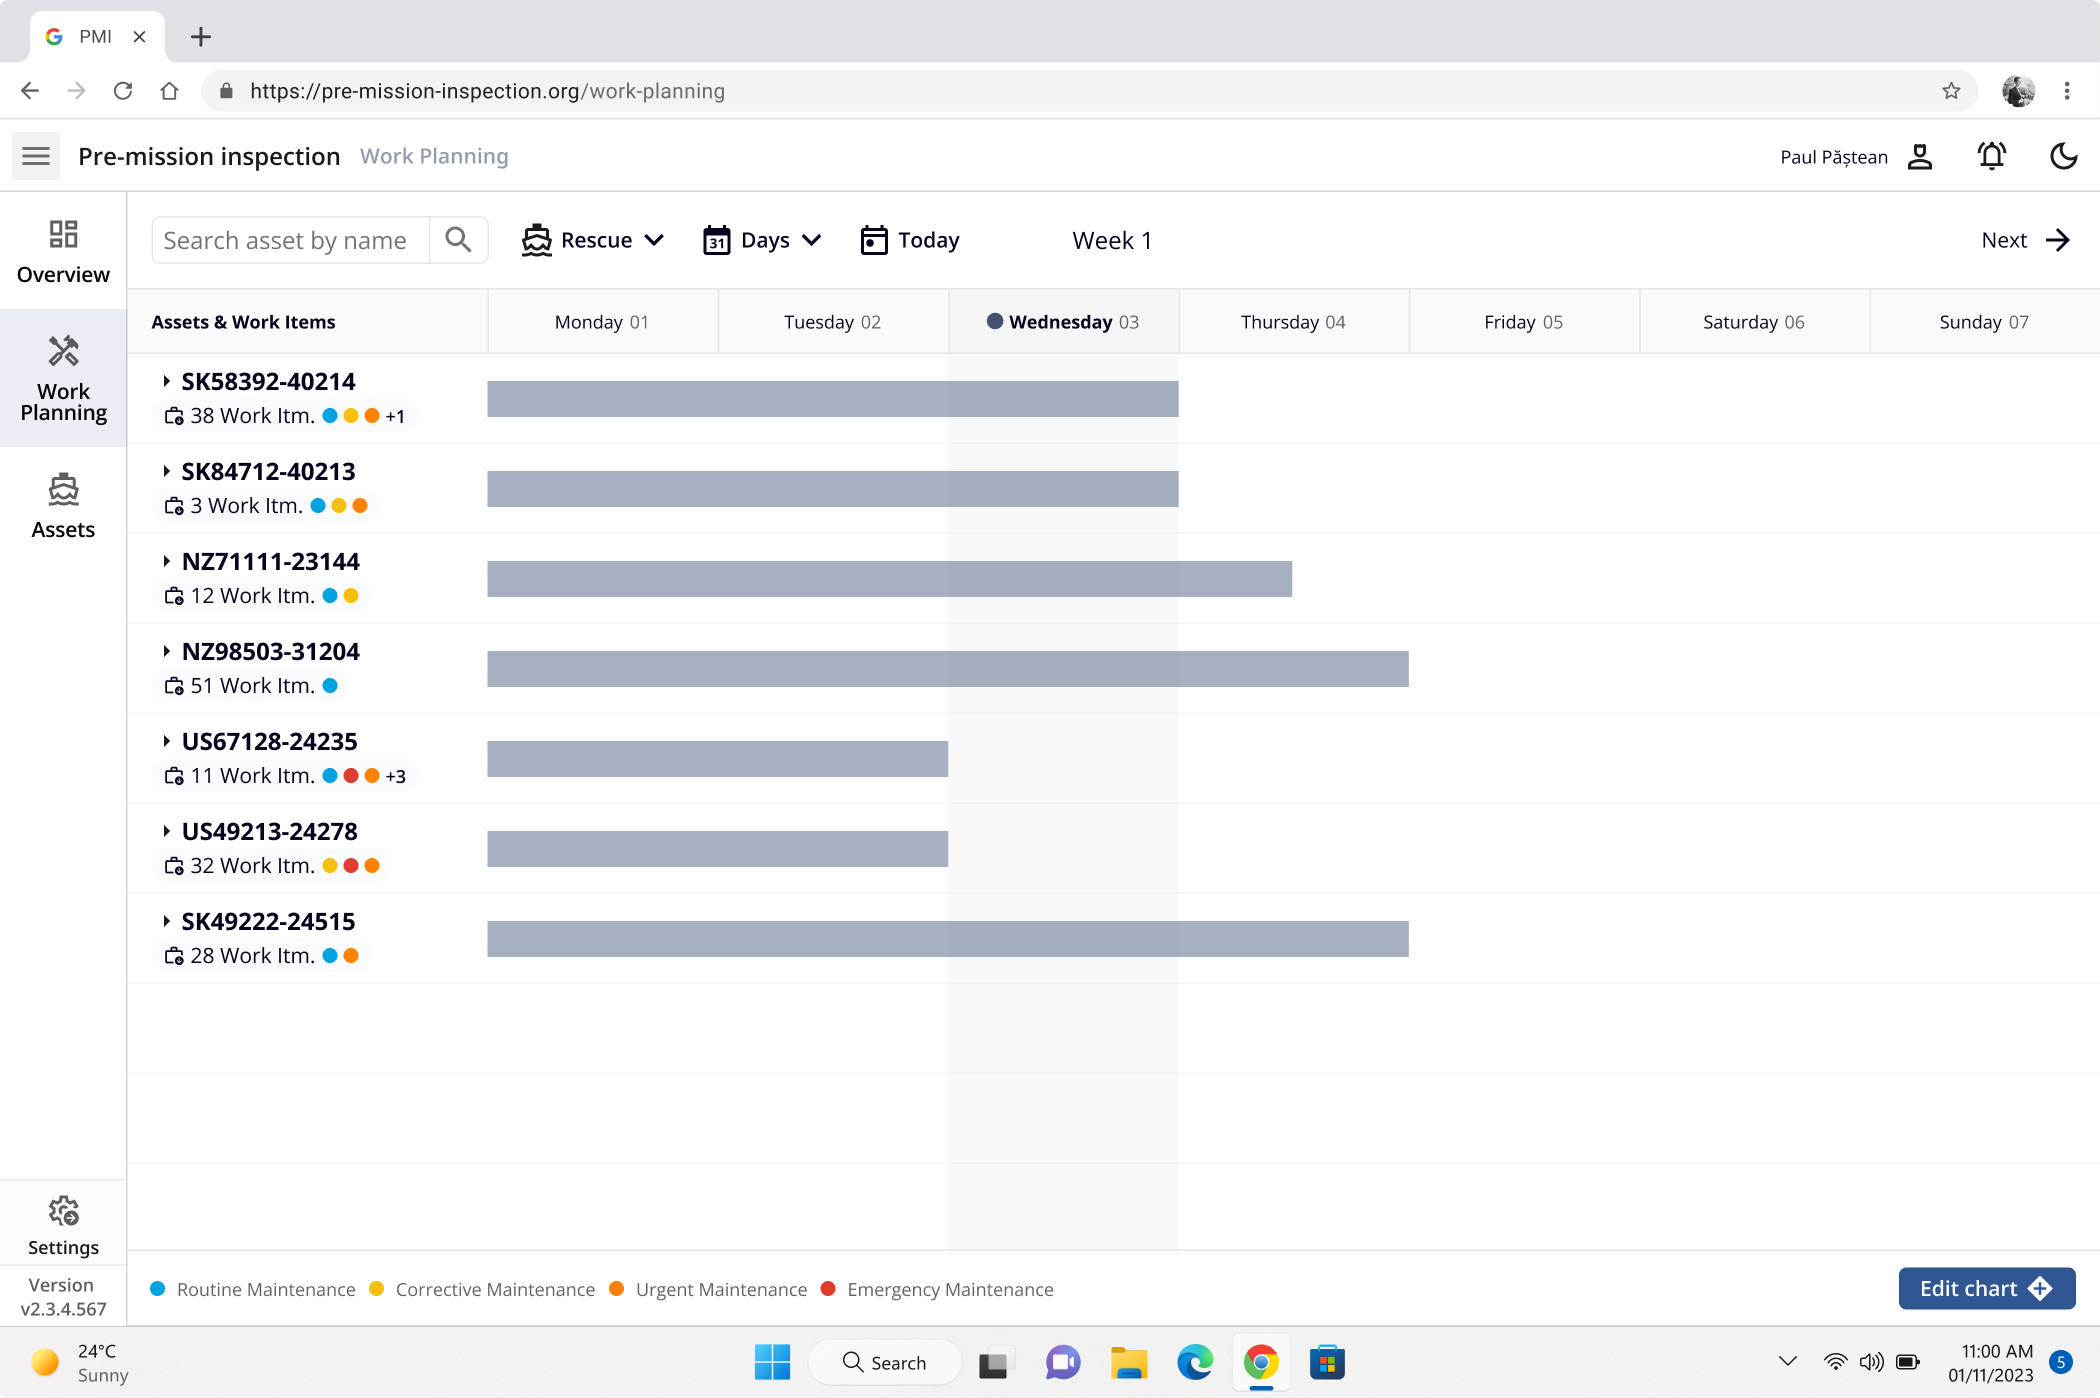
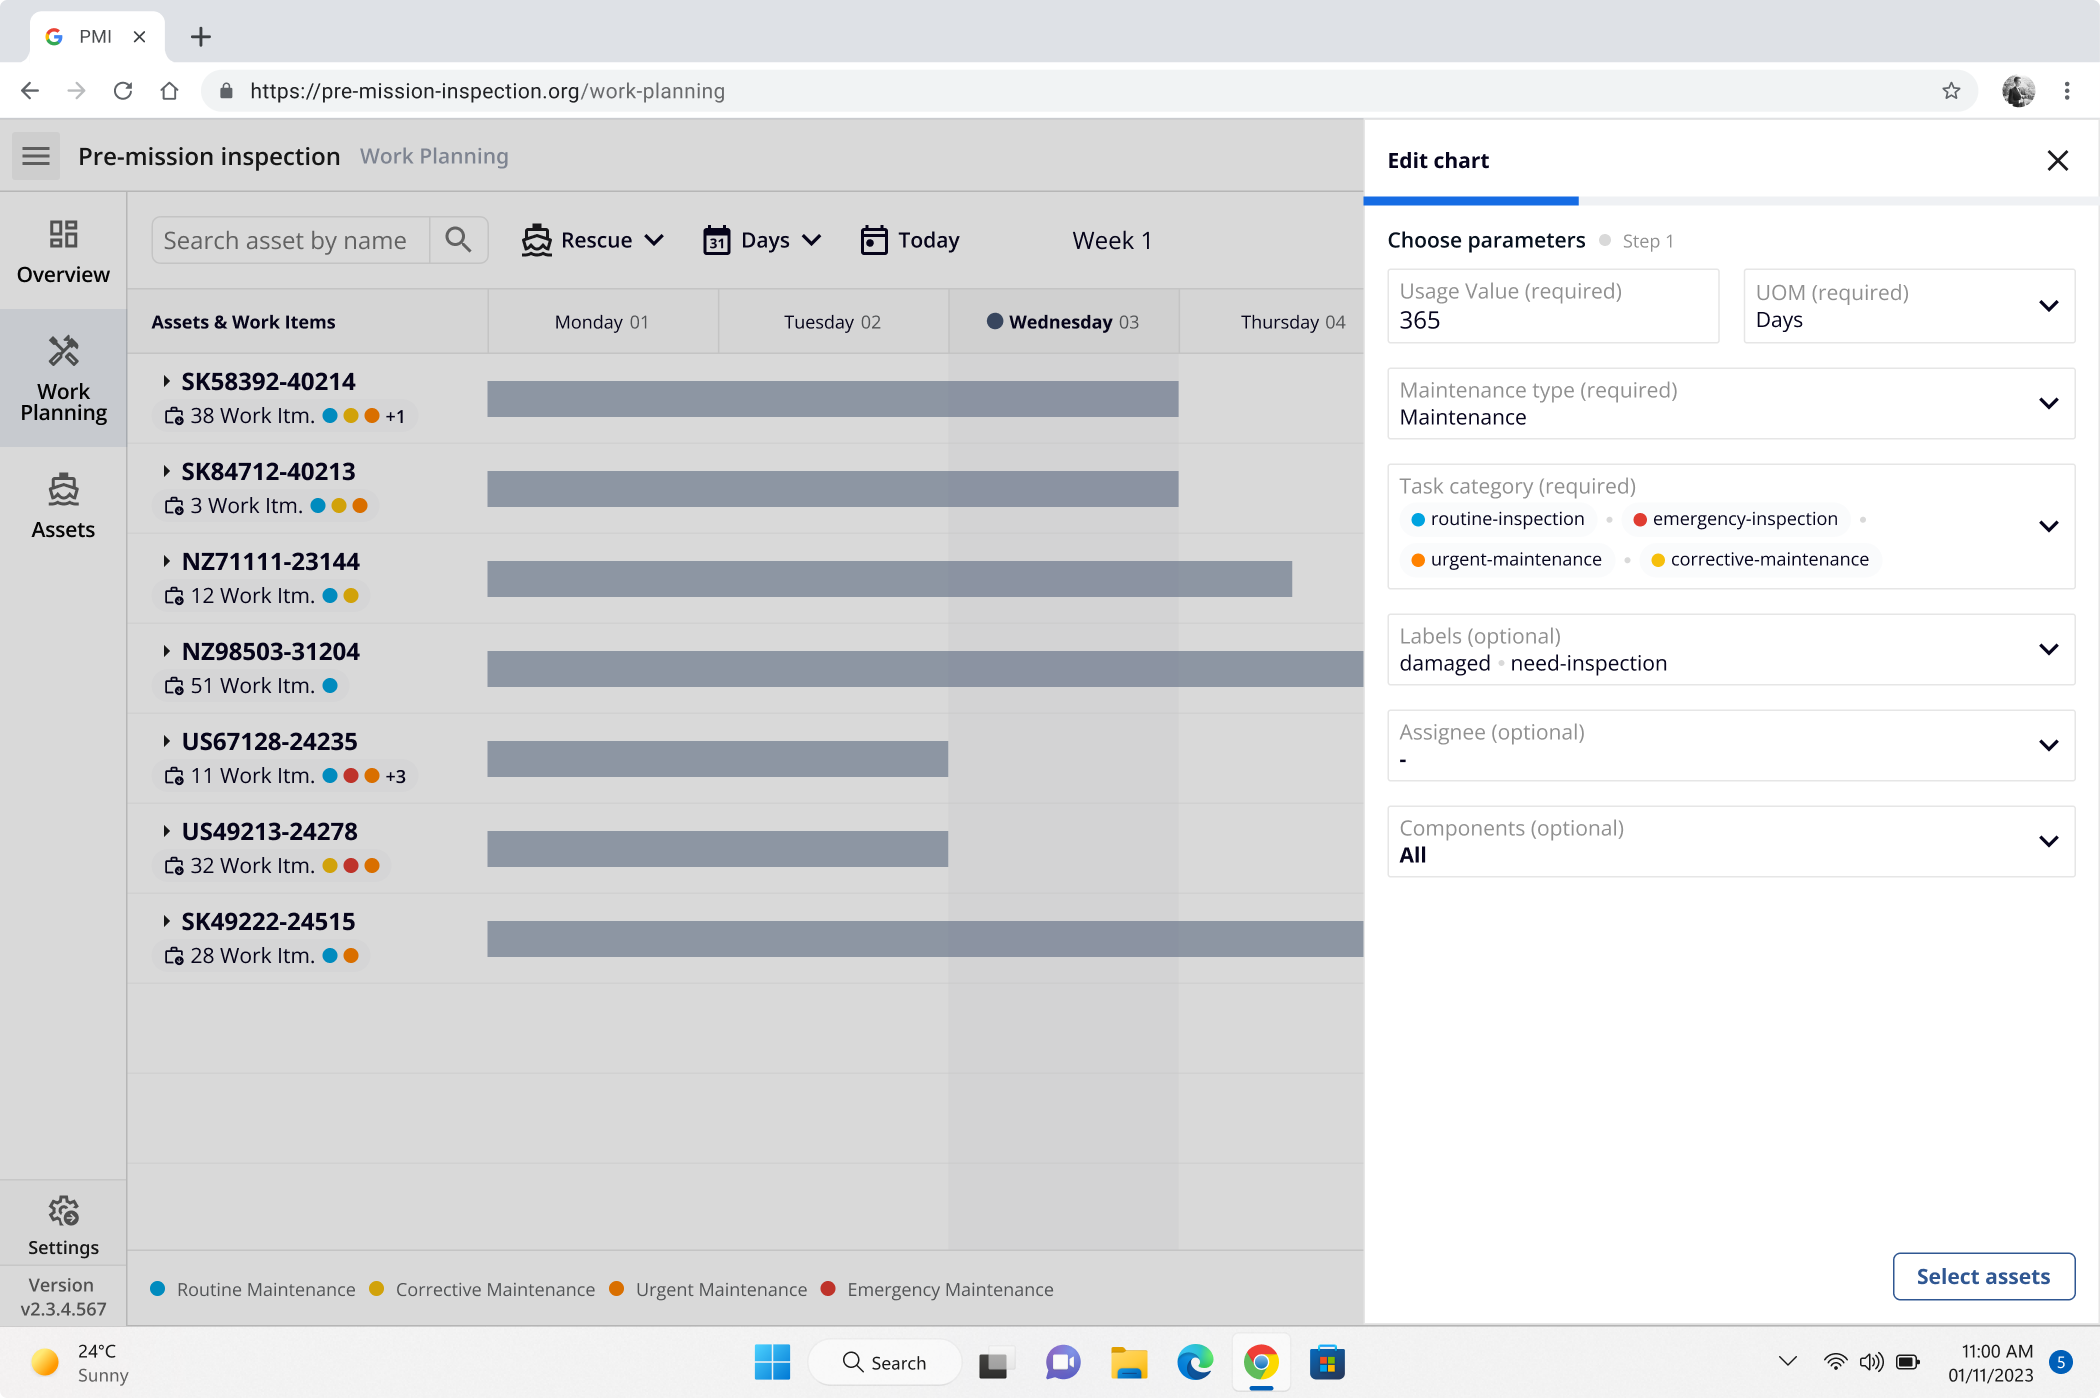
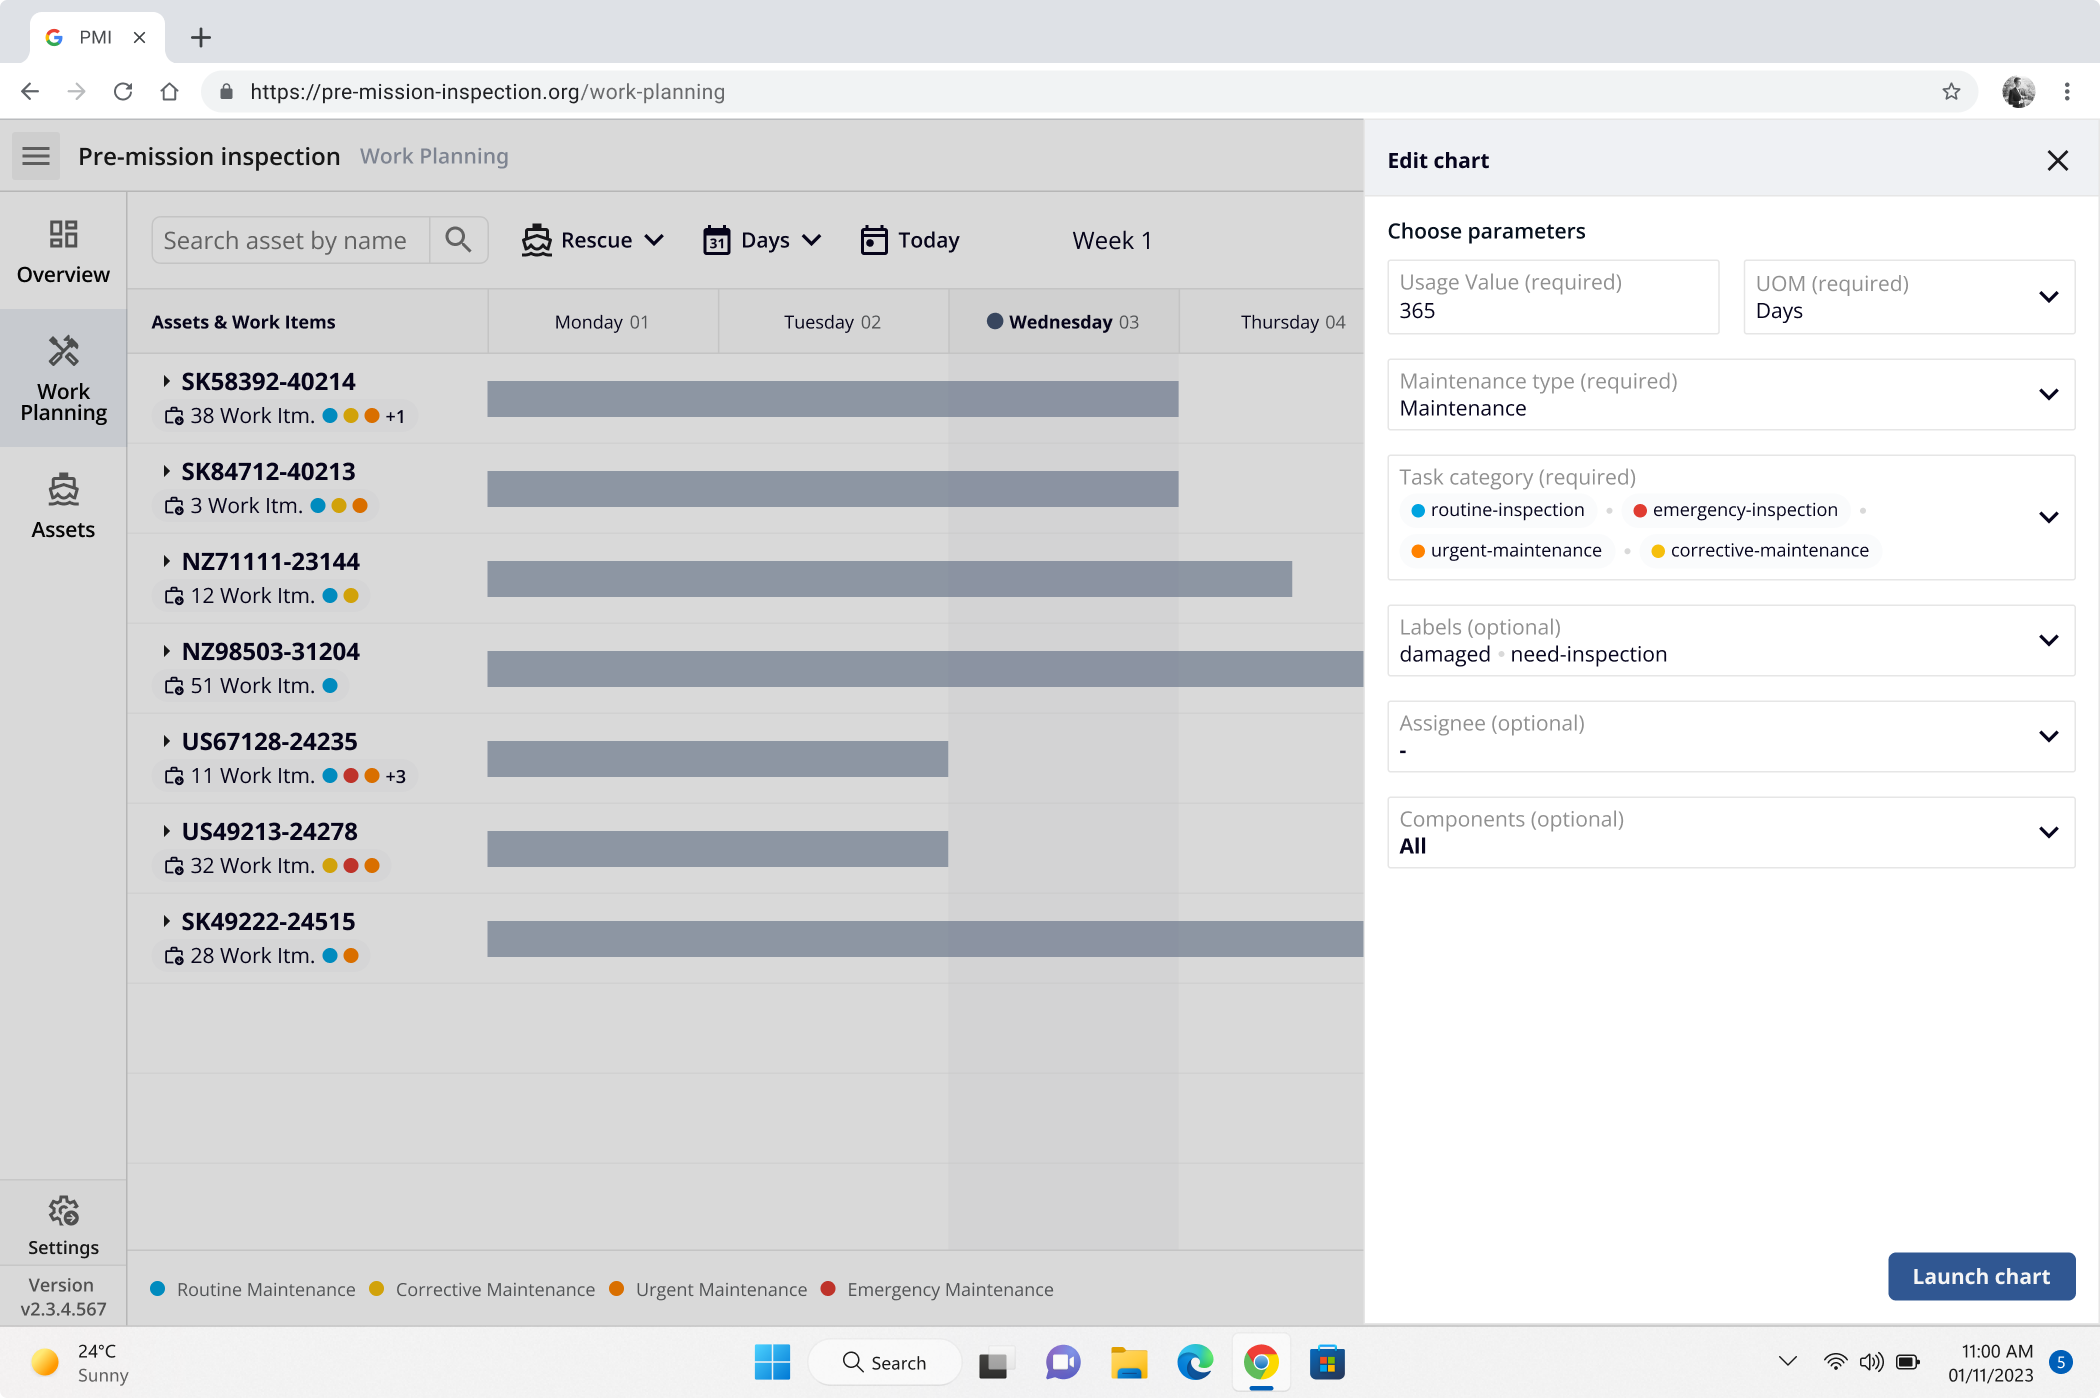
Before
Background & contribution
Background & contribution
The old interface offered no clear task count or hierarchy—users had to hover, guess, and mentally track relationships, leading to daily frustration and wasted planning time.
I redesigned it into a modern Gantt Chart, improving visual clarity and reducing cognitive load to support faster, more confident maintenance decisions across entire fleets.
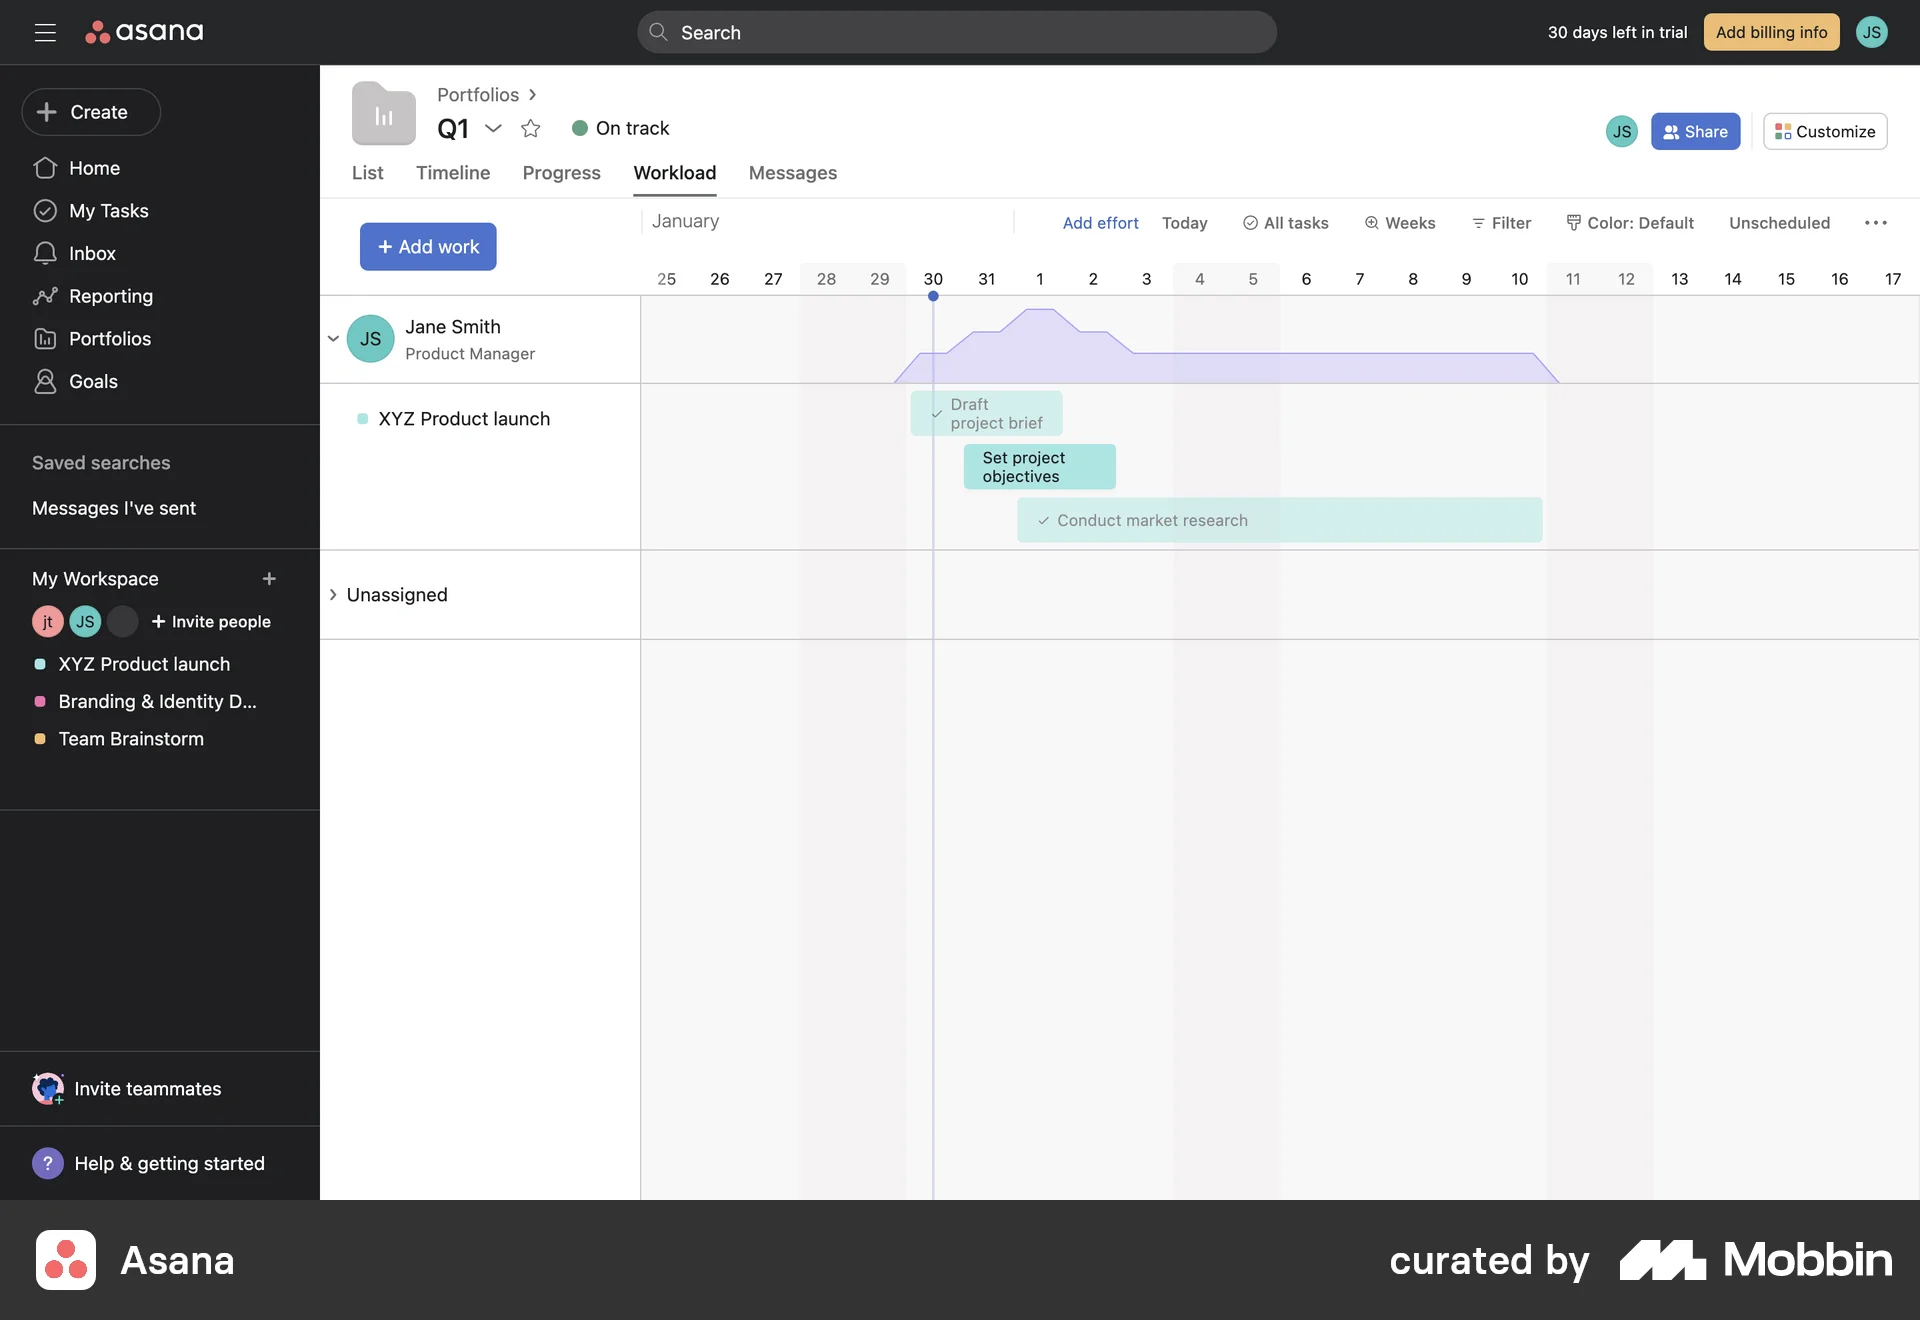
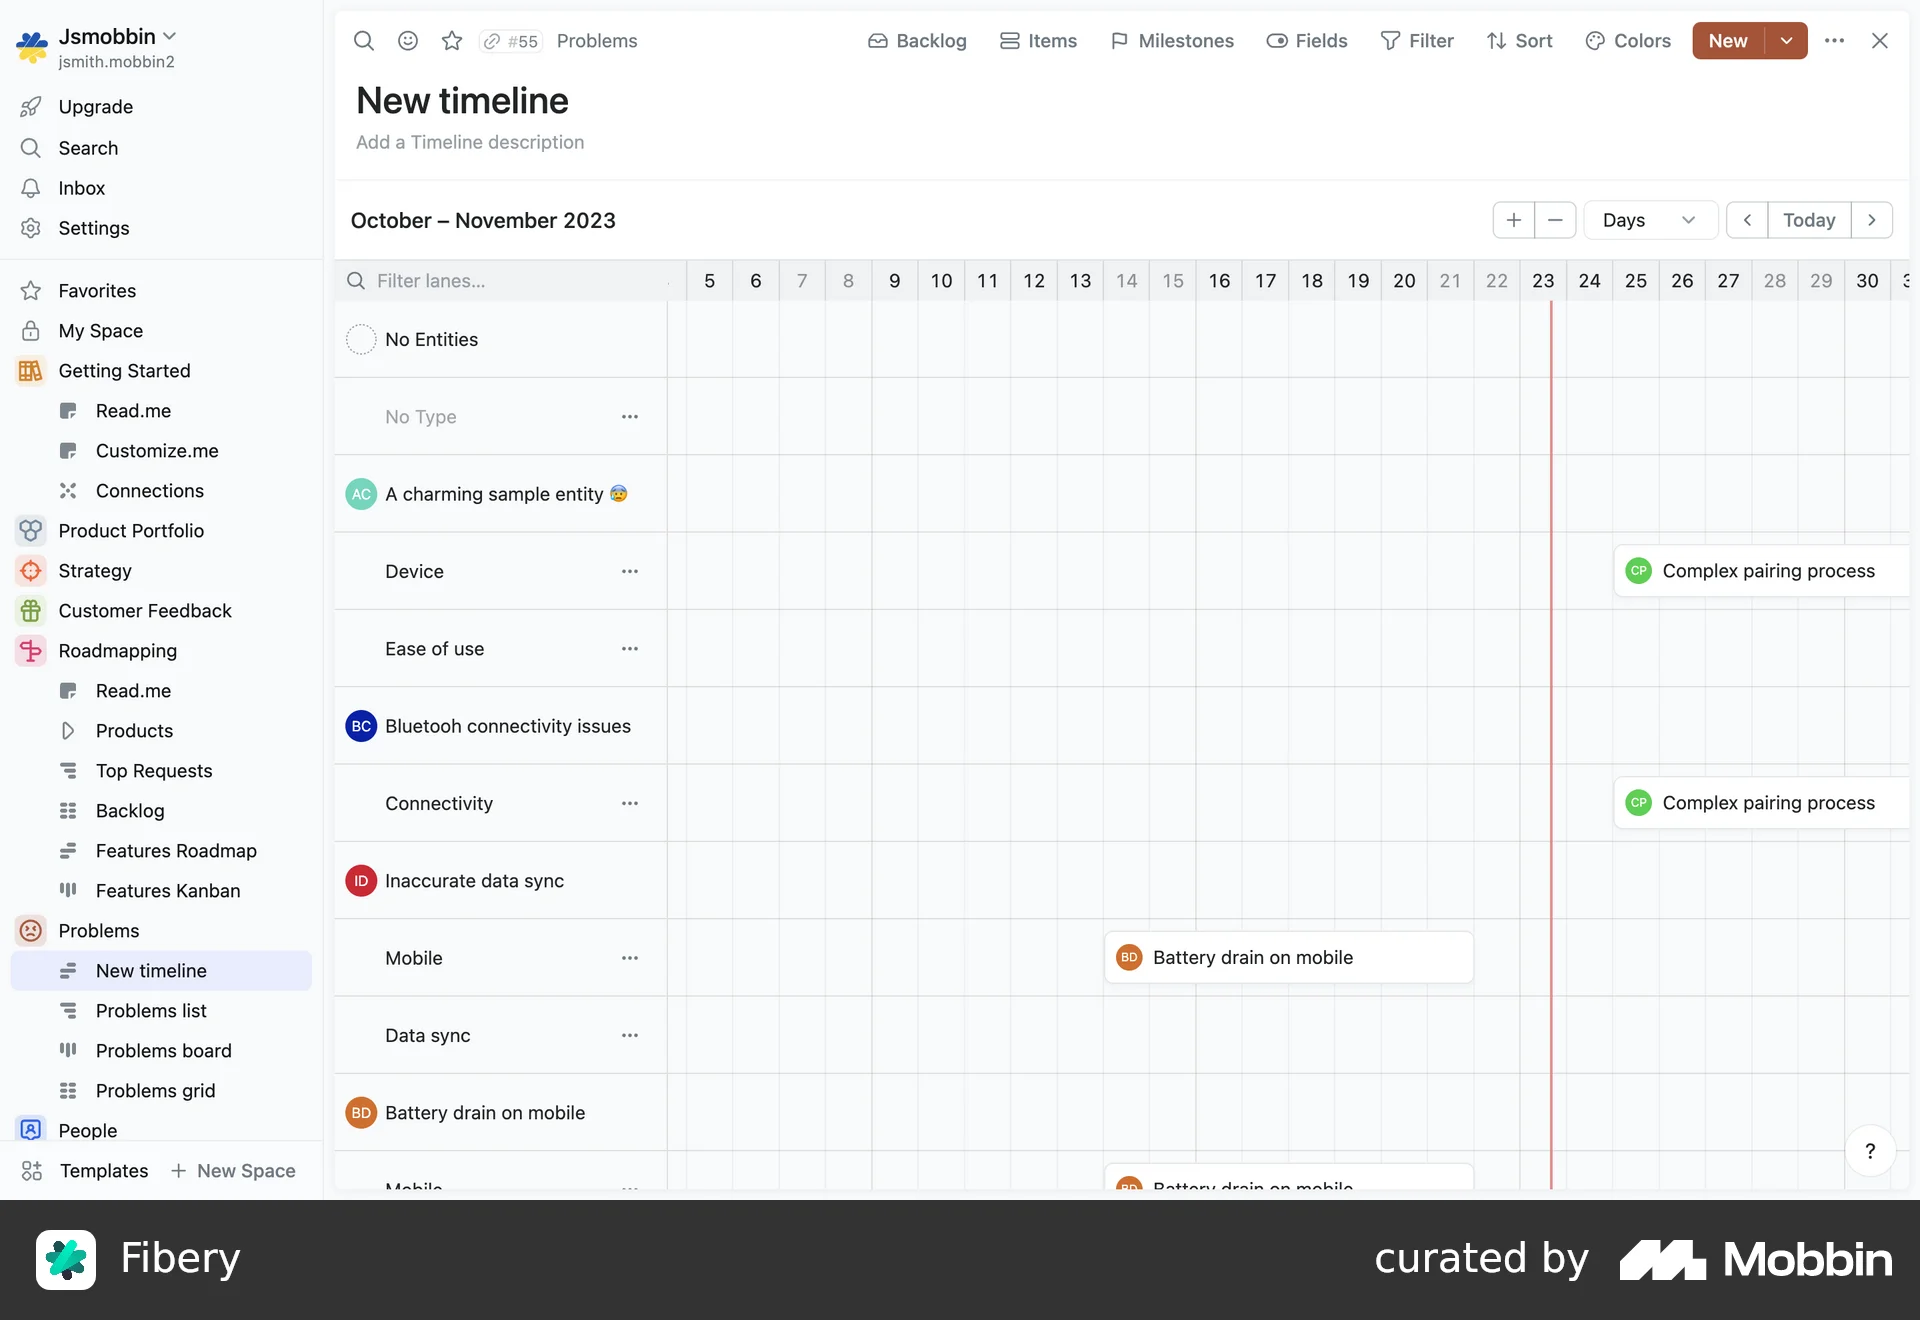
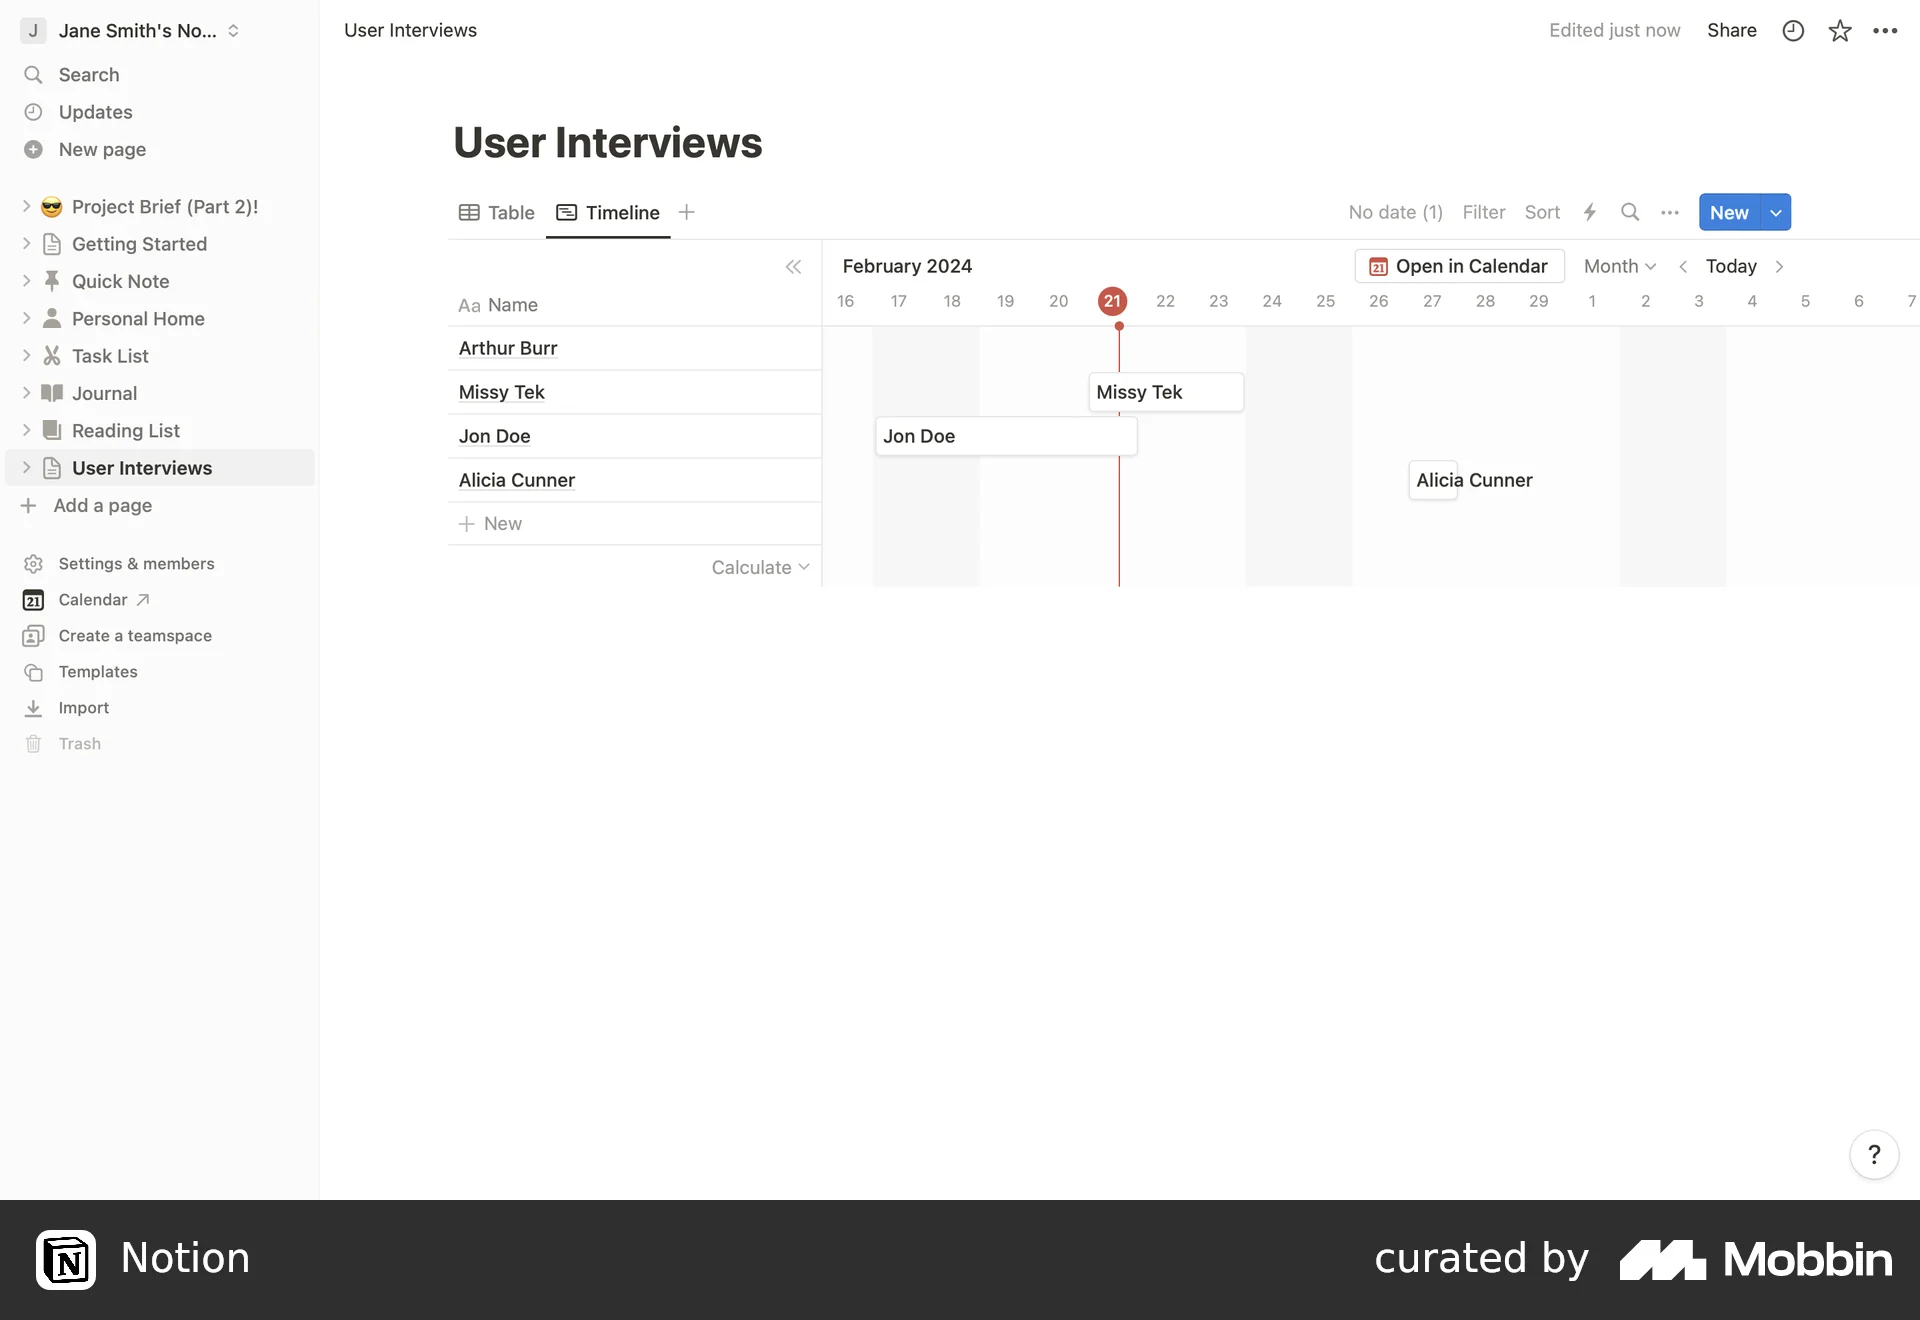
Competitive Analysis Insights
Almost all products had:
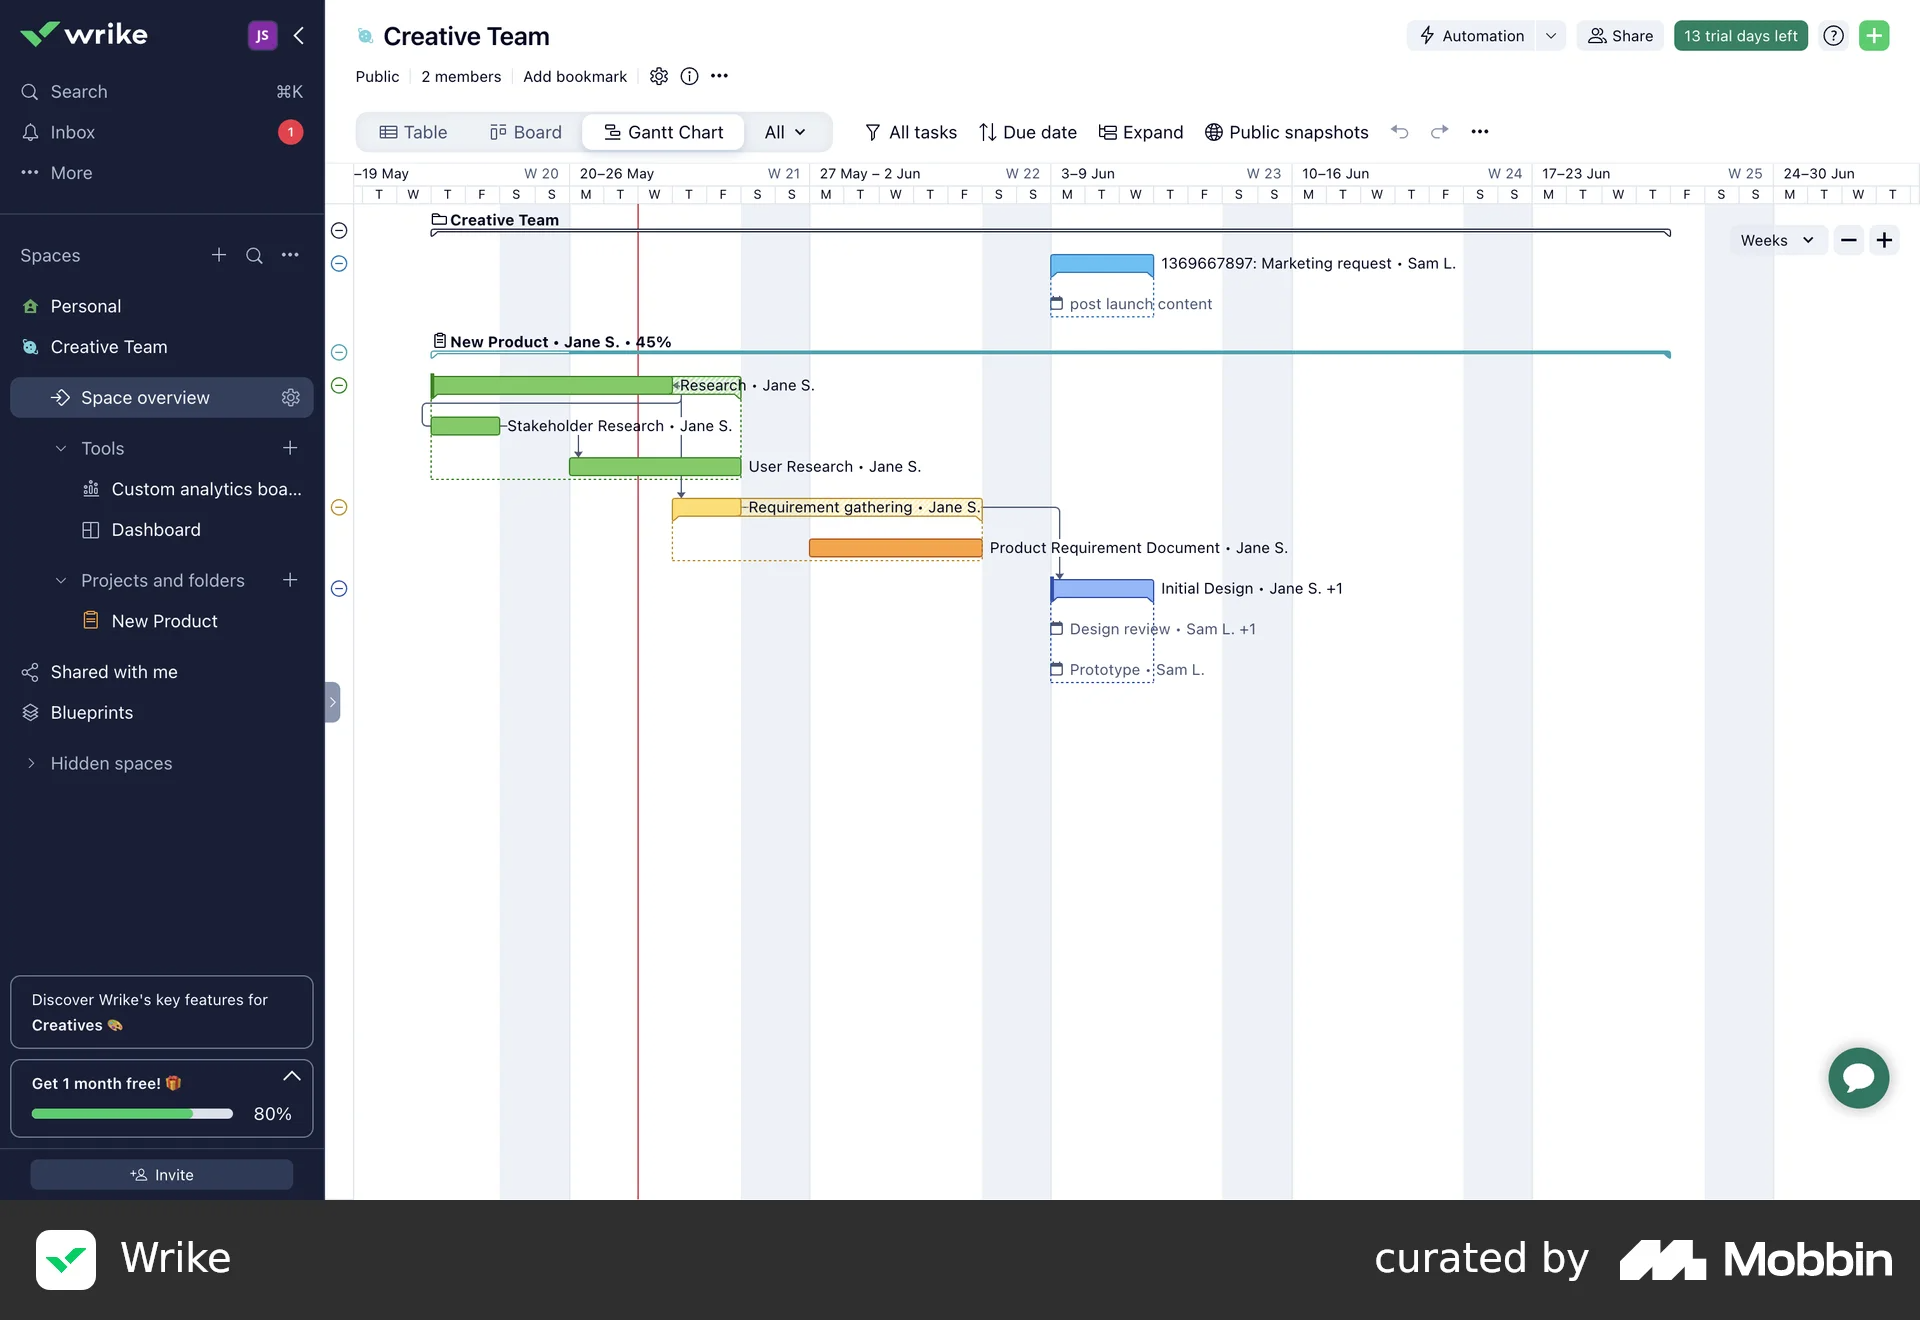
✔️ Layout split in two columns to display work and the timeline
✔️ Calendar that can be filtered by day, week, months and even years
✔️ Task start dates and durations along a time axis for easy scheduling
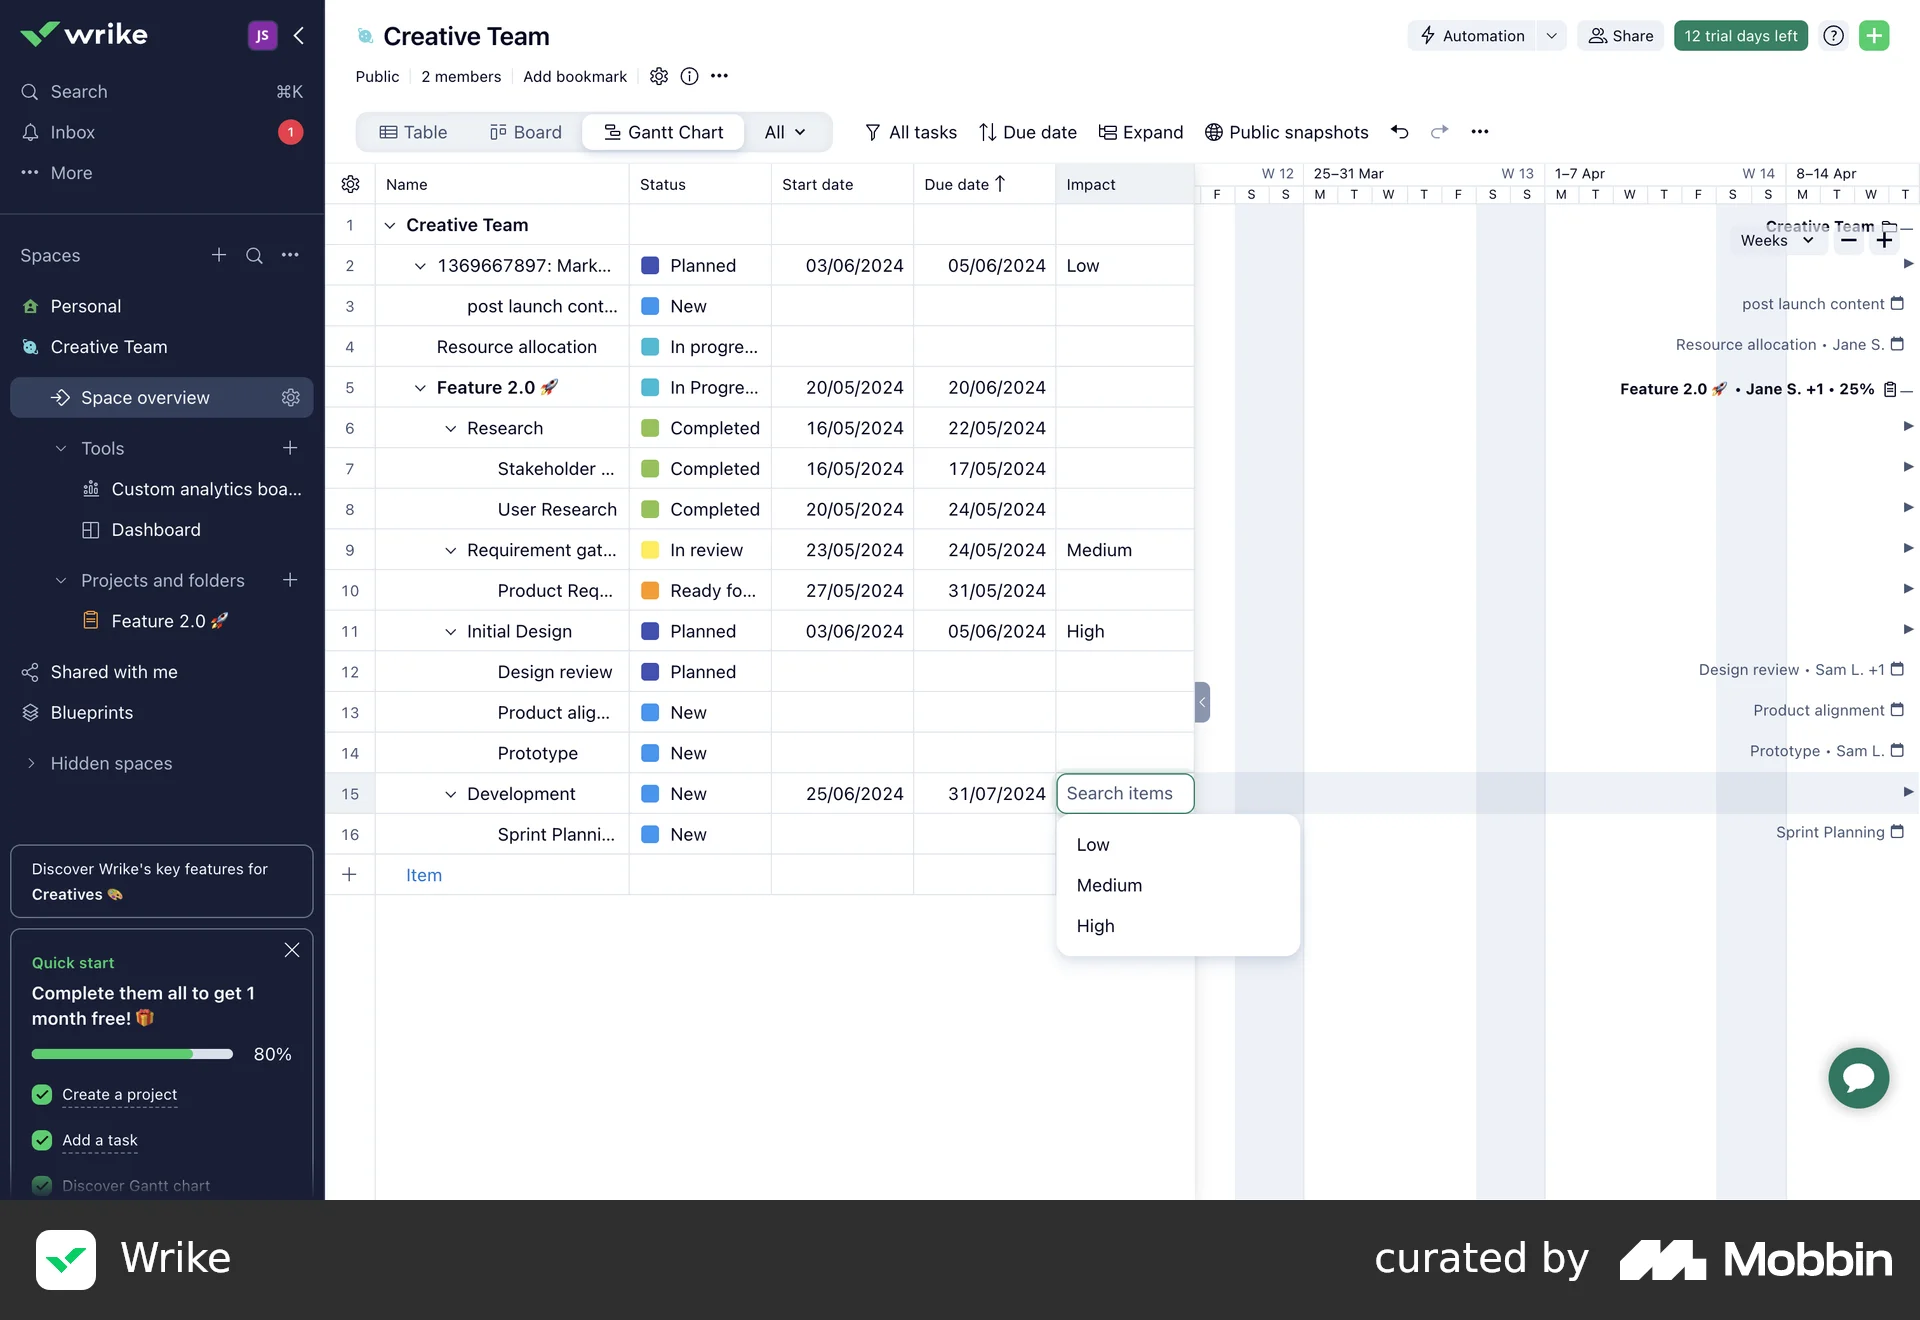
✔️ Filtering by multiple criteria to focus on relevant tasks
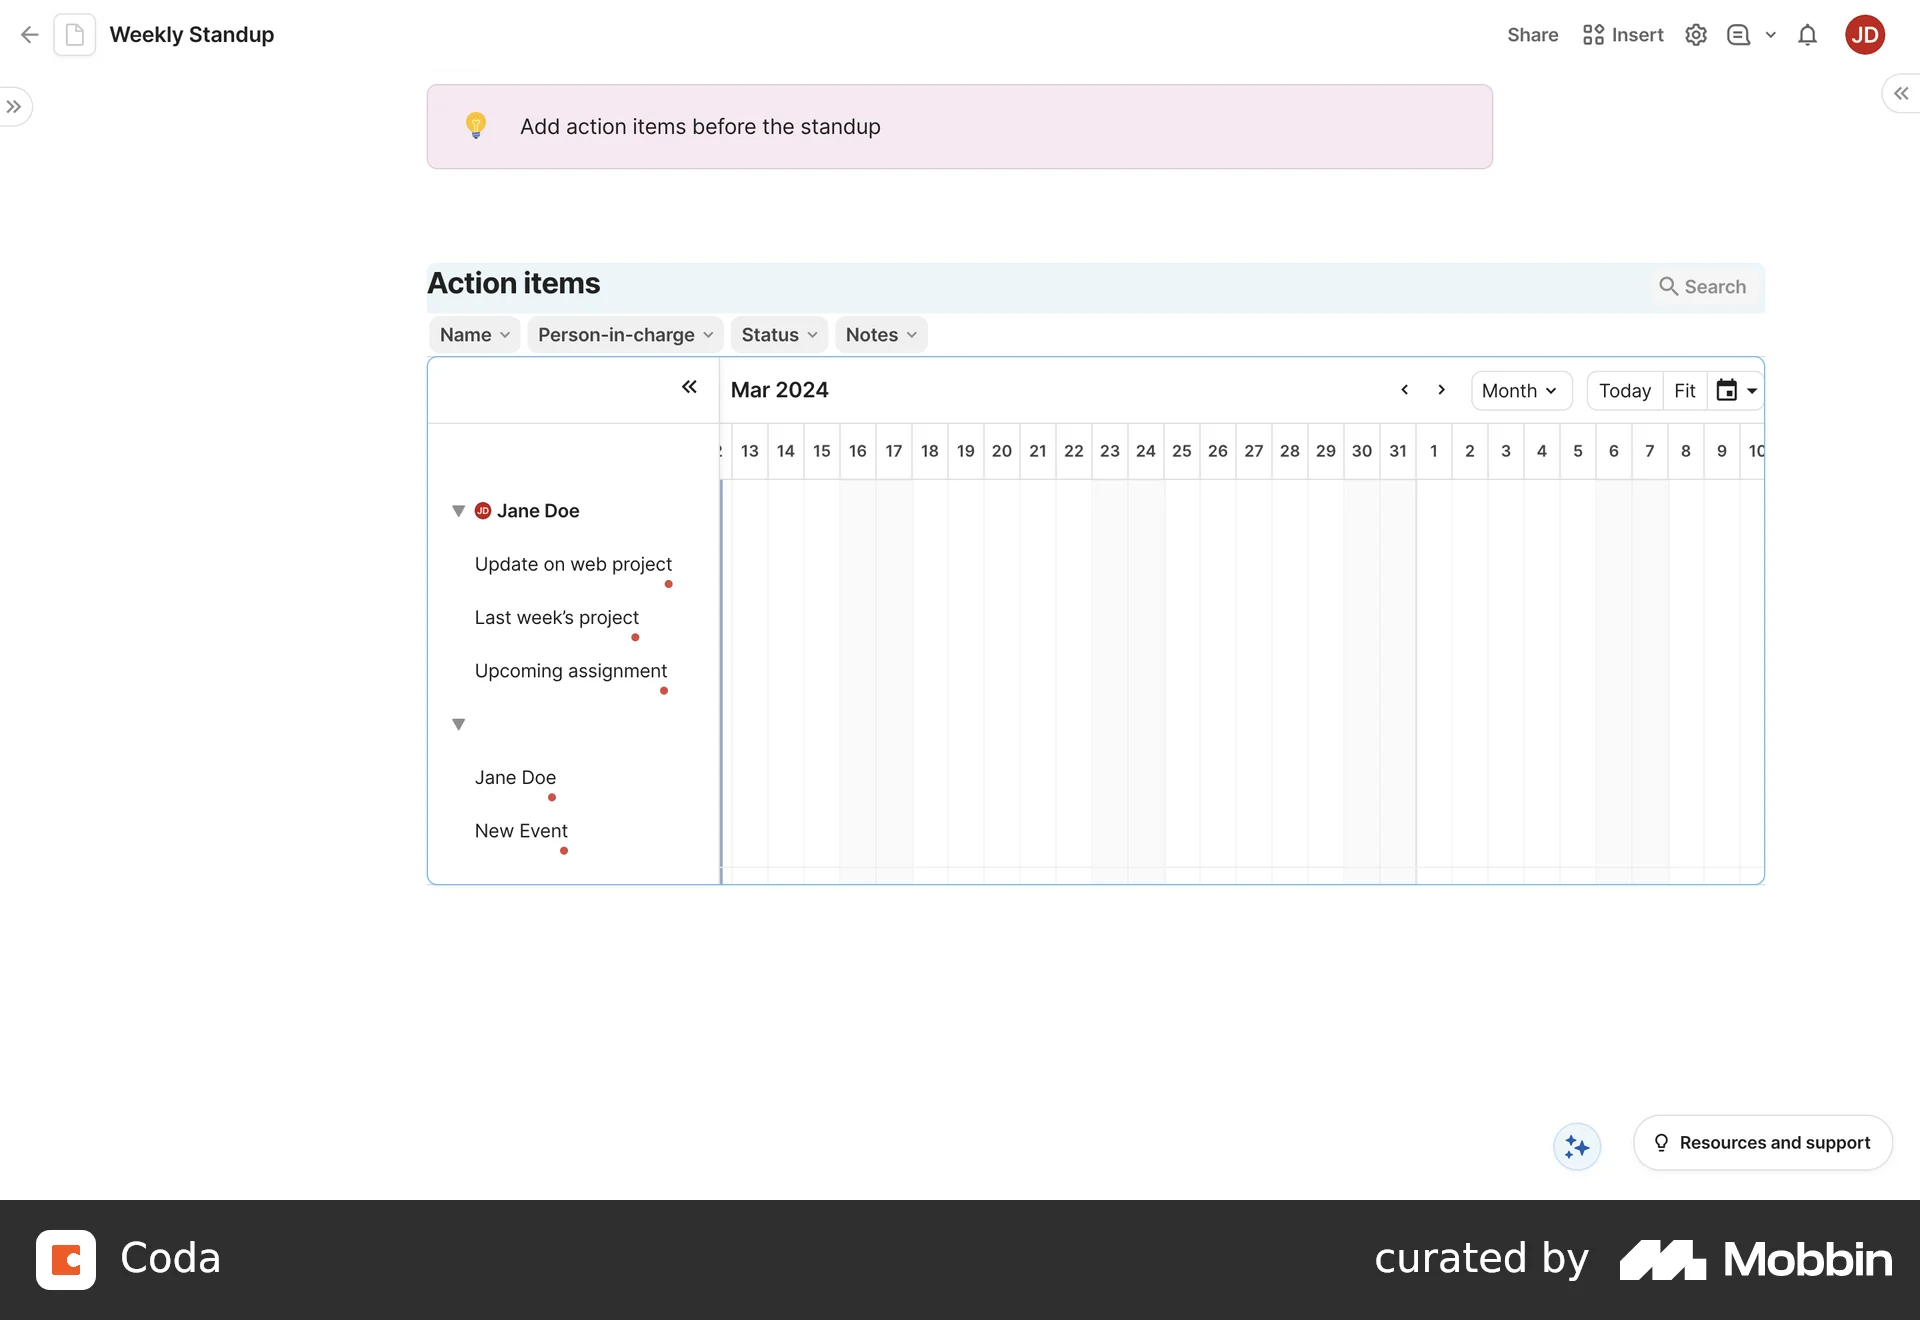
Feature #1
Clear task relationships
To show clear task relationships, I designed a hierarchical dropdown structure, starting from the asset and drilling down to child tasks—mirroring familiar Gantt patterns and supporting infinite rows.
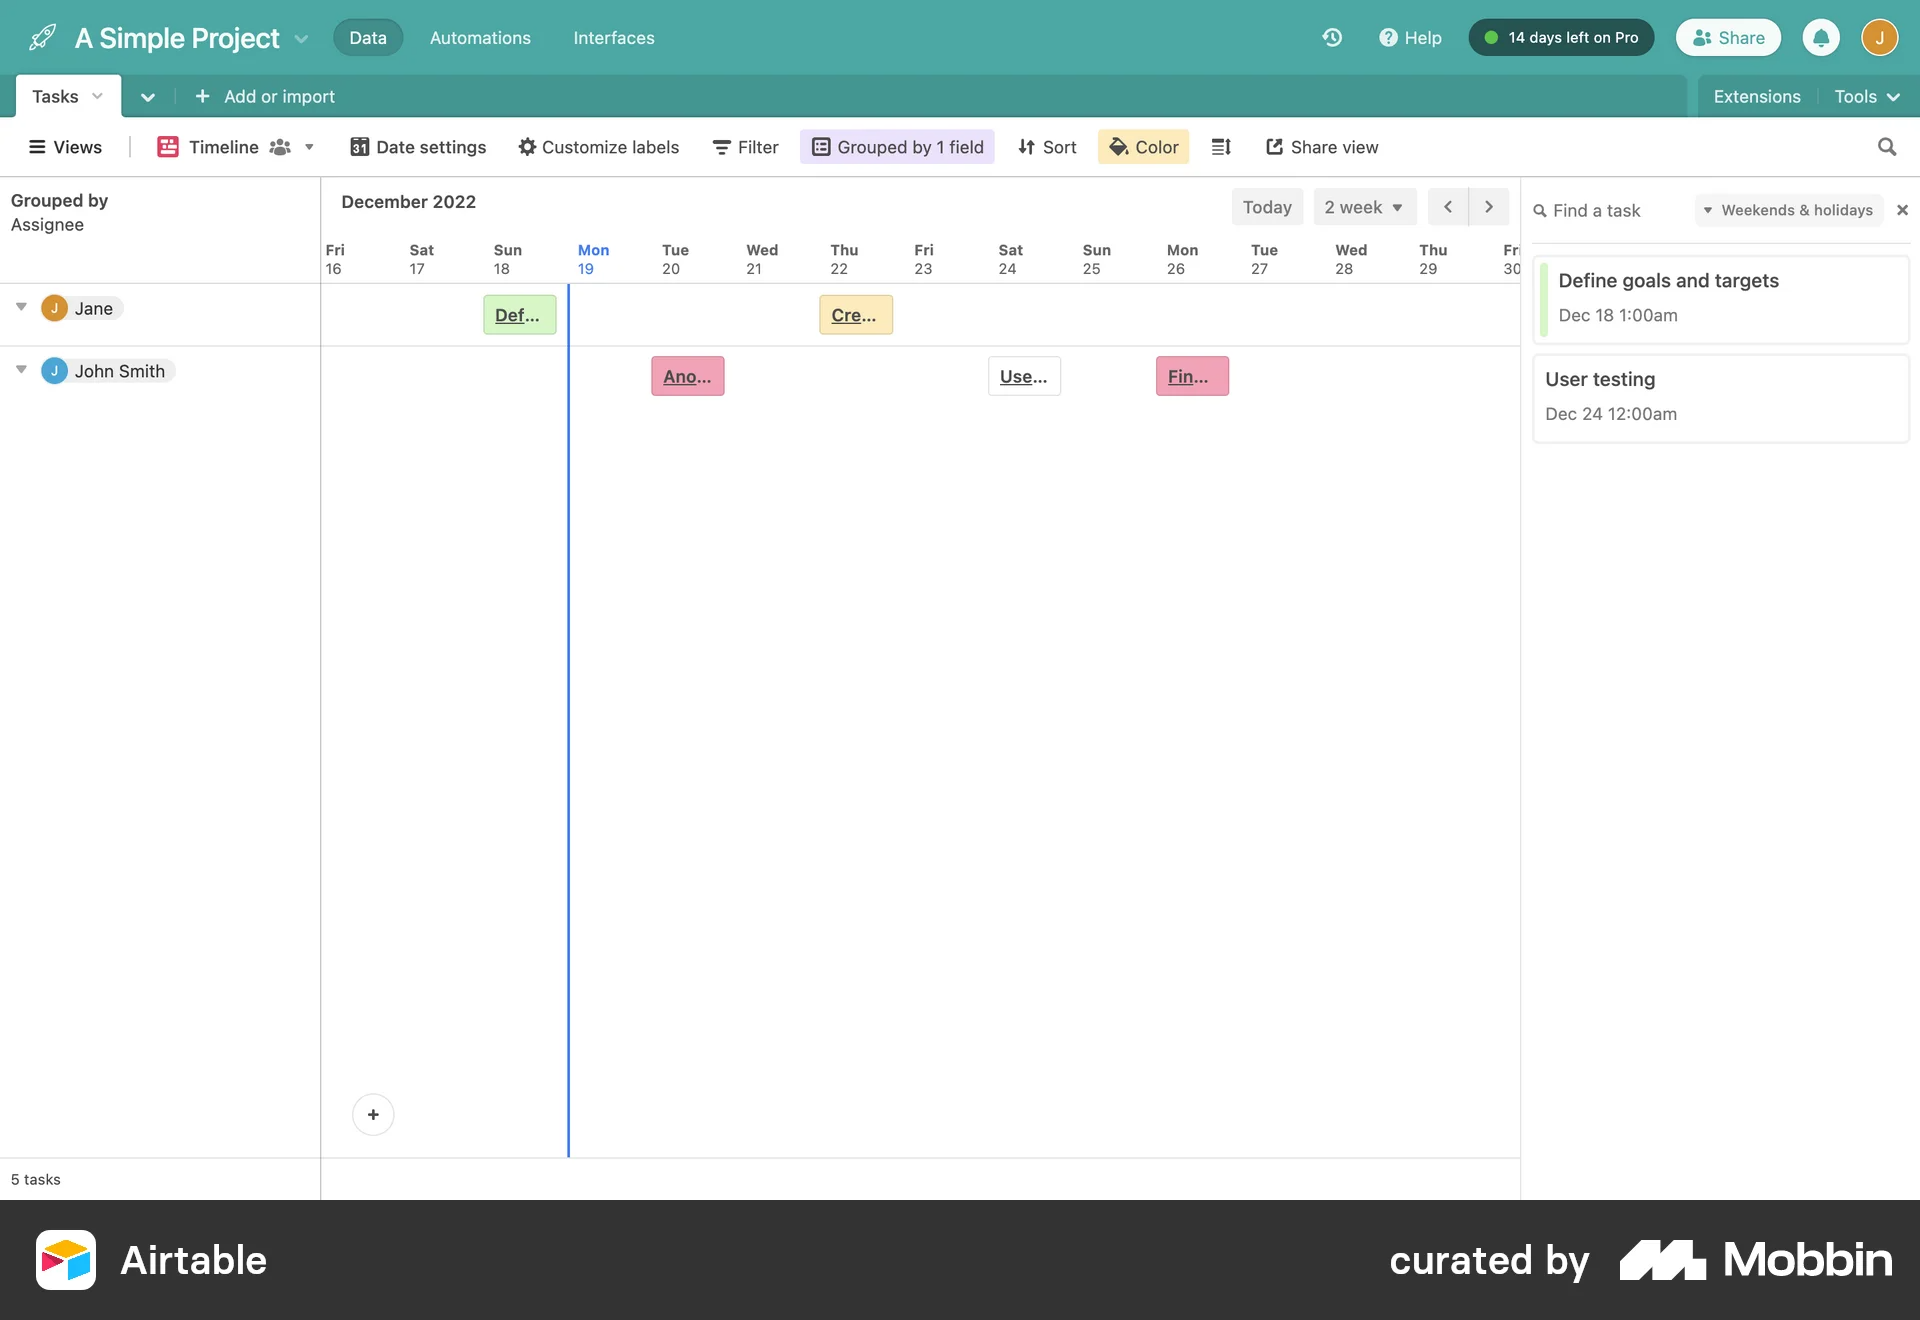
Feature #2
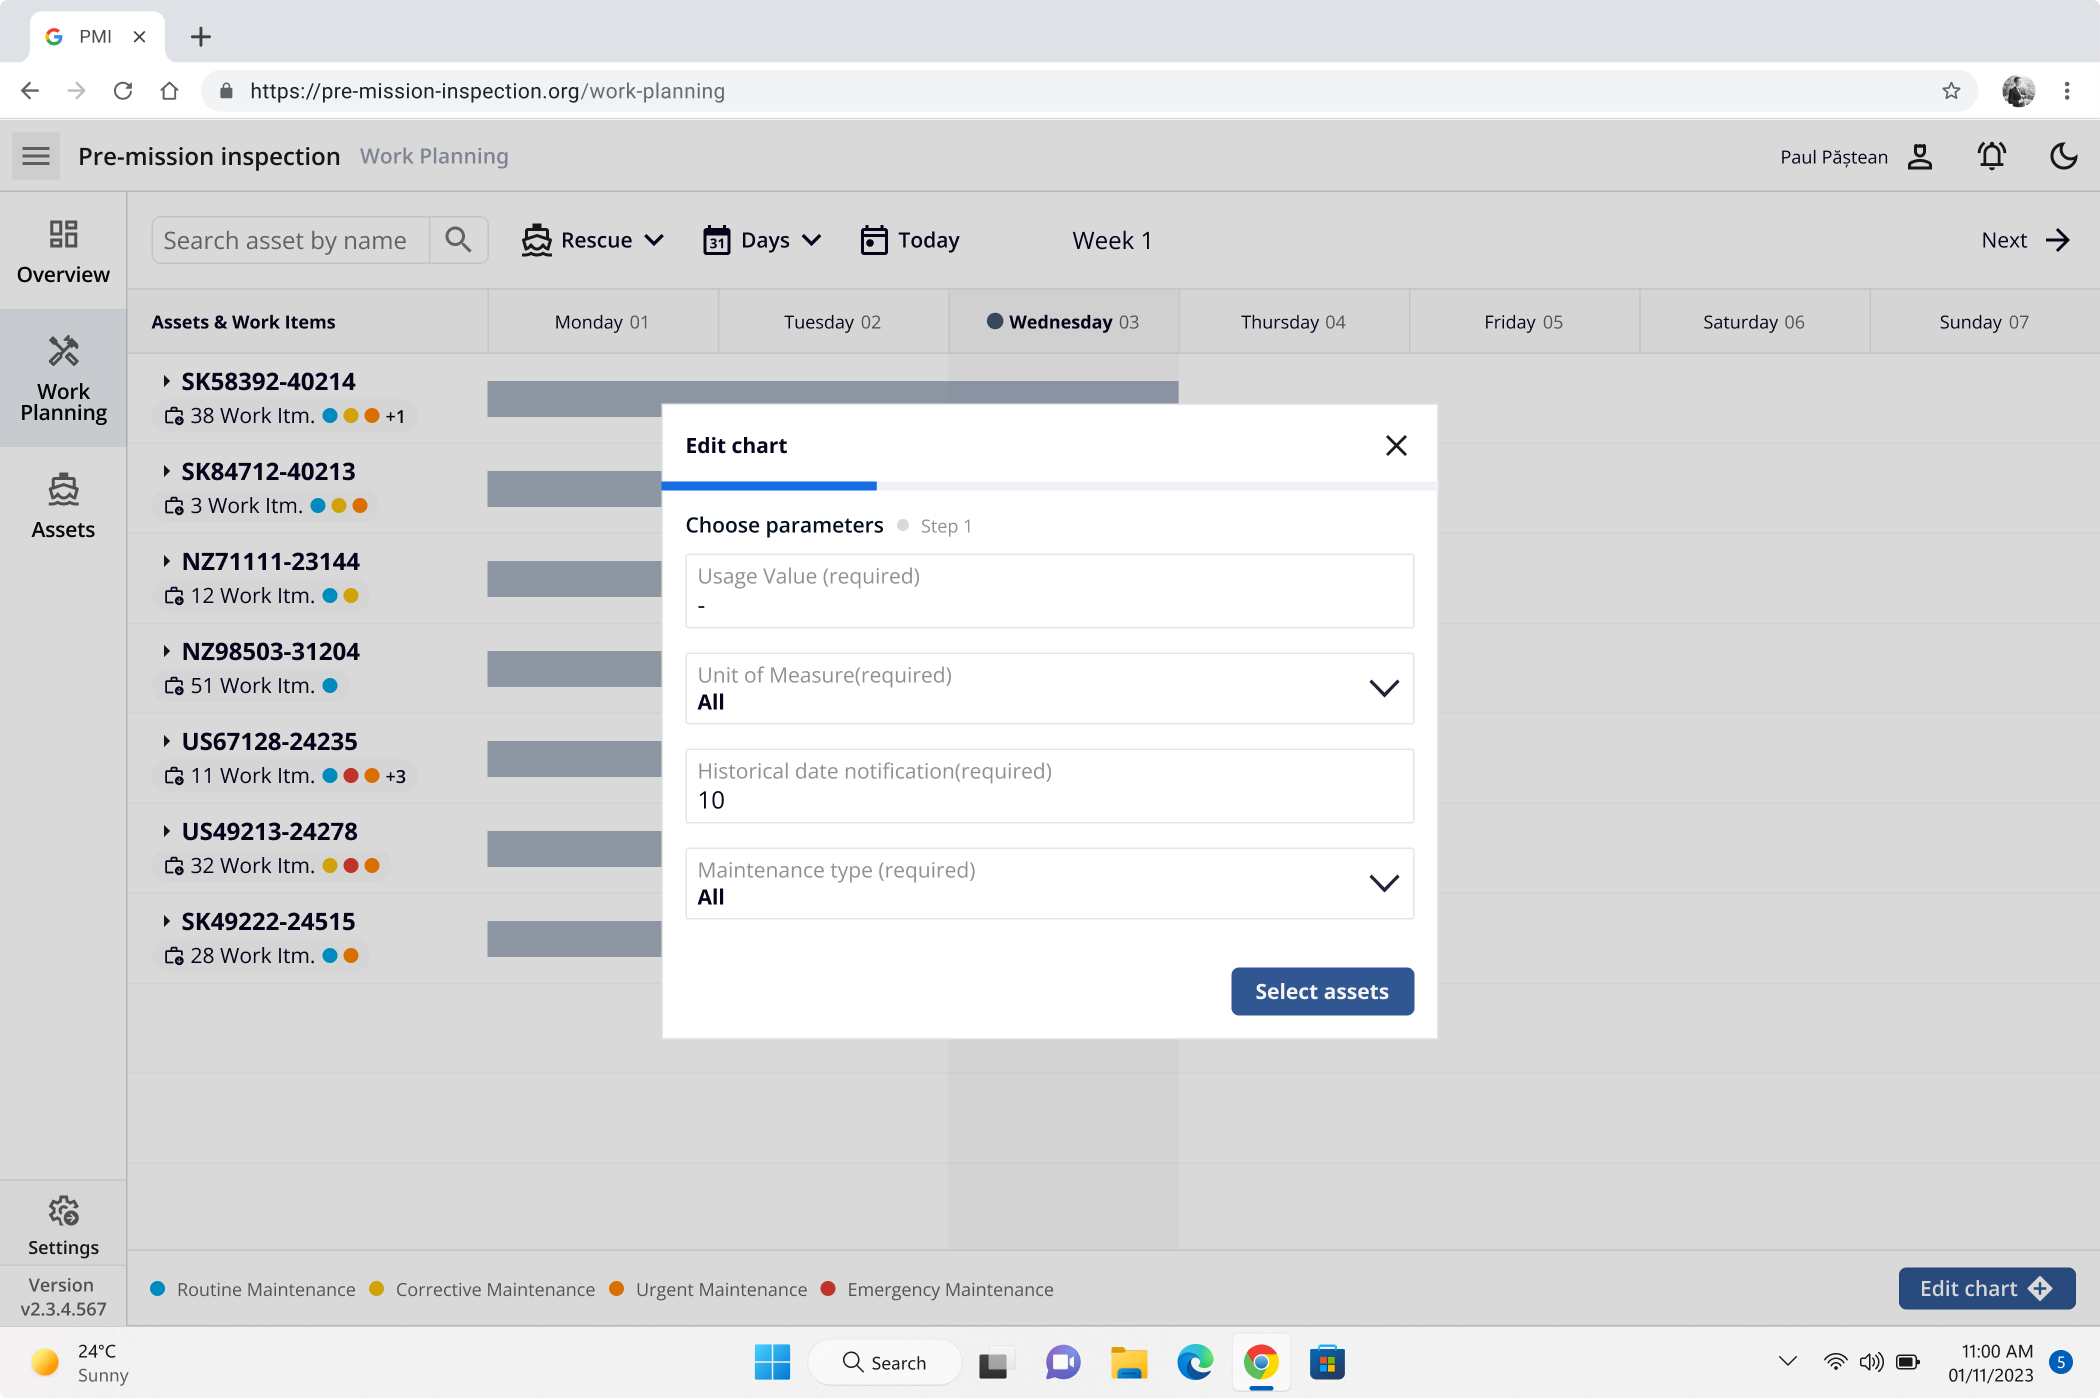
Intuitive filtering
I placed filters near the chart, relying on proximity principles - making it easier for users to quickly sort tasks and focus without losing context.
Feature #3
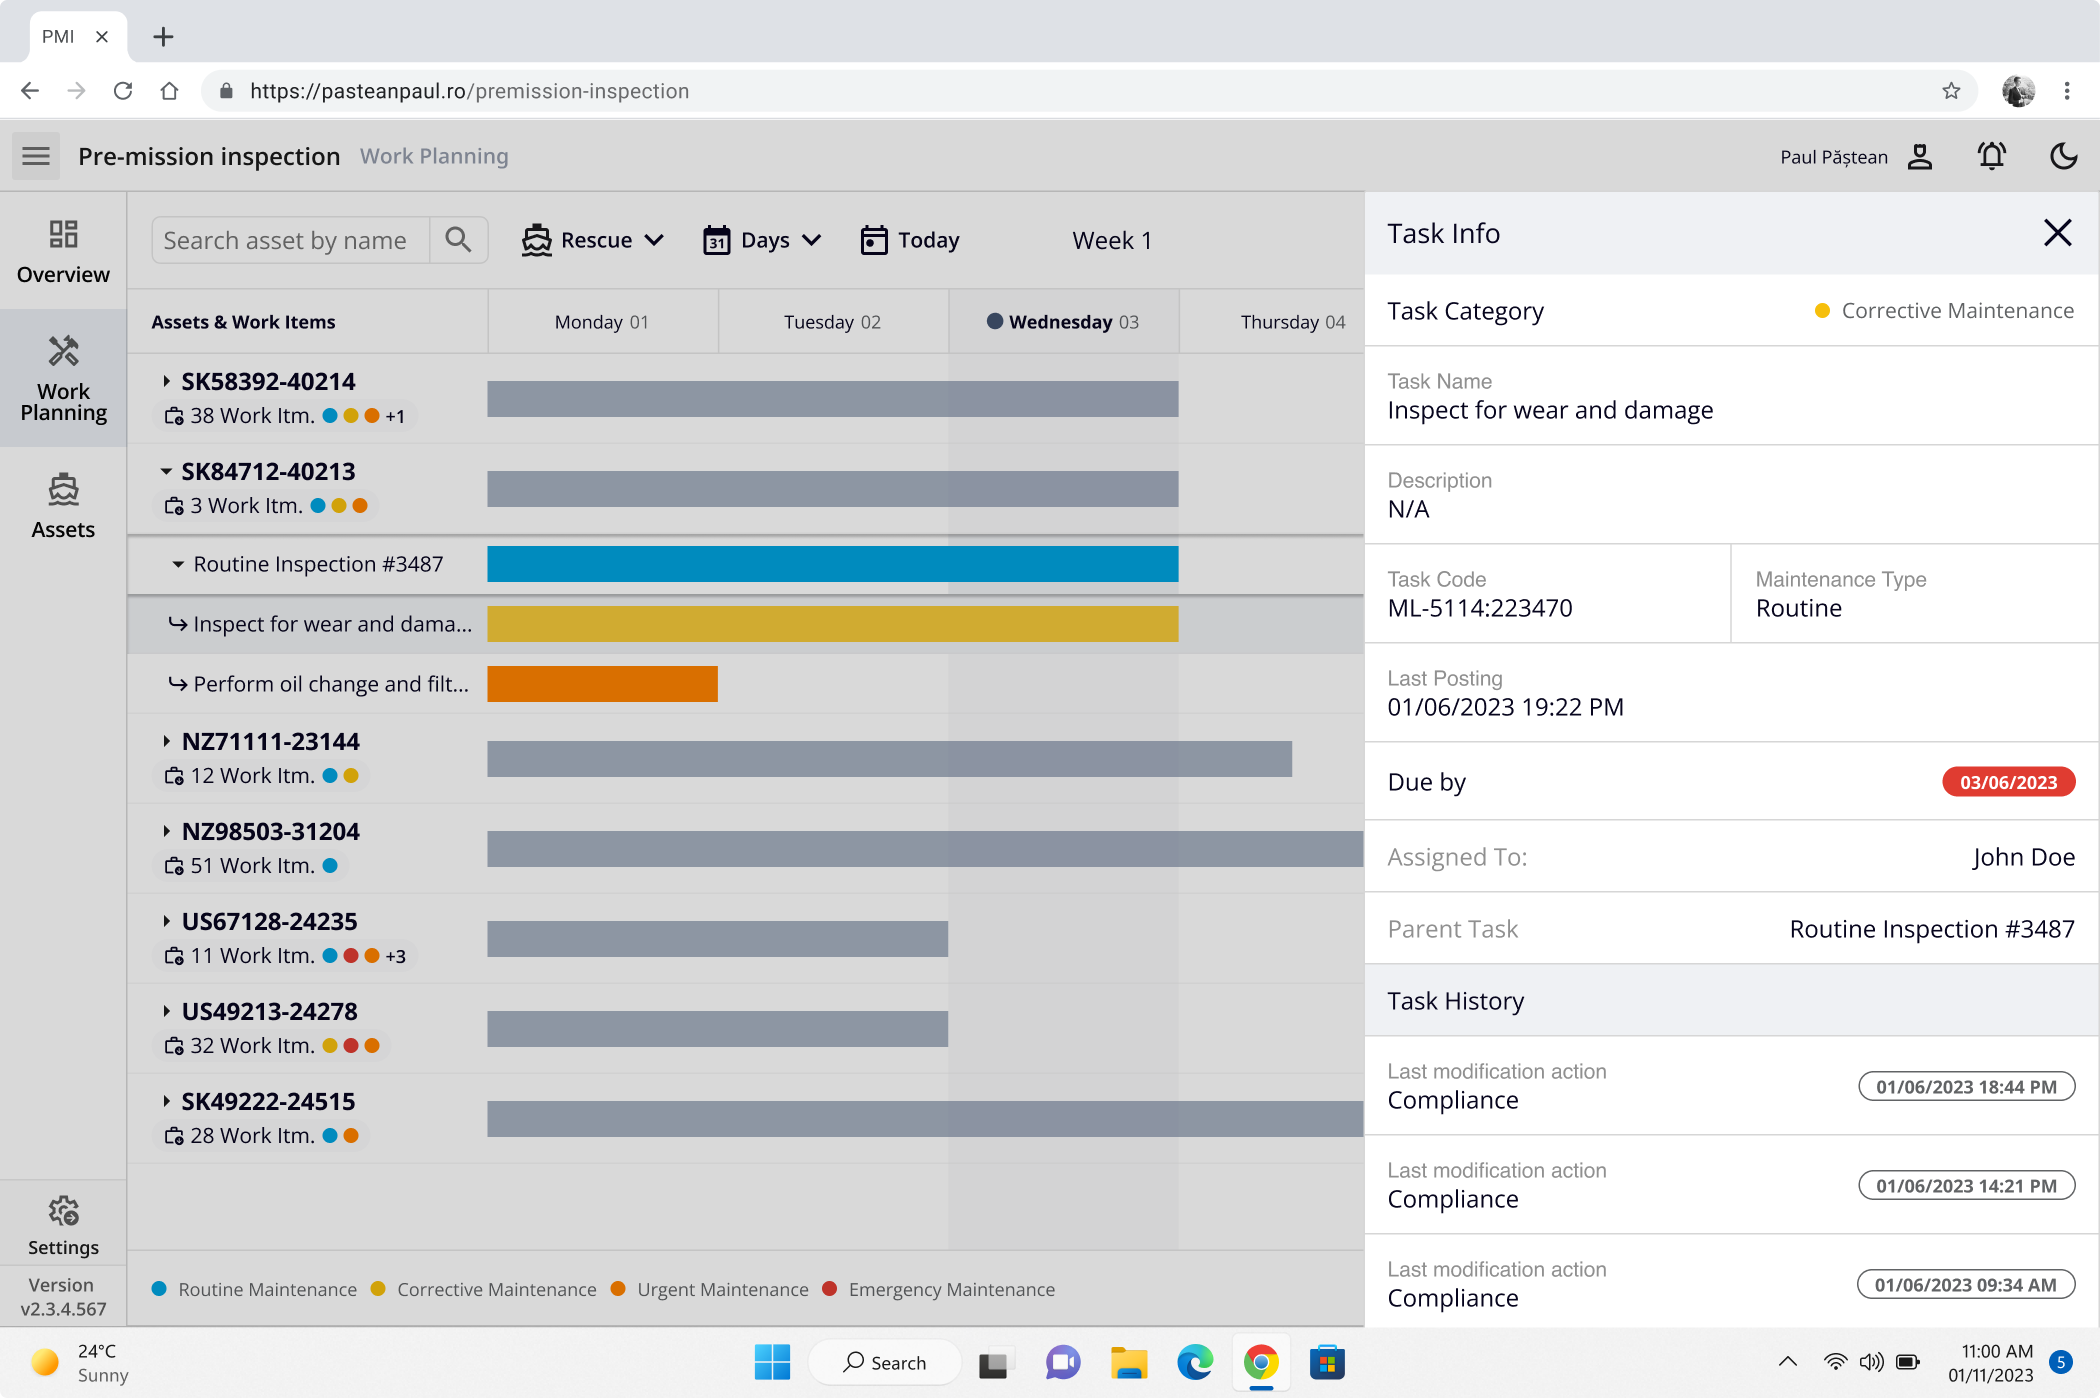
In-context quick actions
I introduced contextual UIs(drawer and modal) to let users quickly inspect task details and edit chart information without breaking workflow or losing focus.